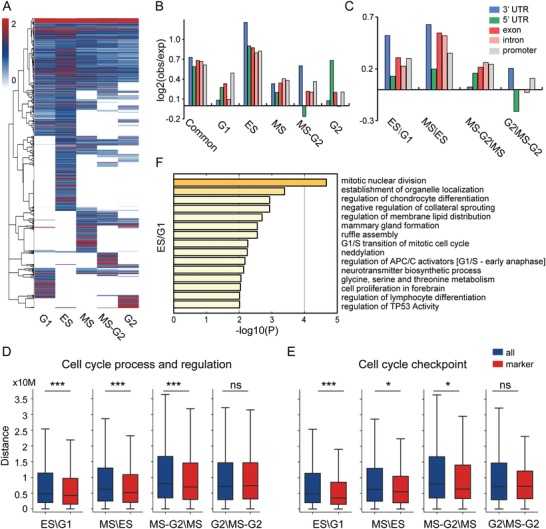
Figure 4.

Interpretation of regulatory events of dynamic chromatin substructures. A) Hierarchical clustering of TAD boundaries with high confidence based on insulation strength across five substages. B) Enrichment of overlapping between TAD boundaries and genomic features. The boundaries consist of common and stage‐specific ones. C) Characterization of differential loops relative to different genomic features. Differential loops are detected between two continuous stages. These loops appear in the first loop list, but not in the second loop list (e.g., appearing in ES not in G1 for ES\G1). D,E) The distance distribution from background genes (all) and two annotated gene sets (marker) to differential loop lists between two continuous subcycles. Statistical significance is calculated by Wilcoxon rank‐sum statistic (*P < 0.05, **P < 0.01, ***P < 0.001, ns, not significant). F) Functional enrichment analysis of genes overlapping with differential loops between ES and G1.
