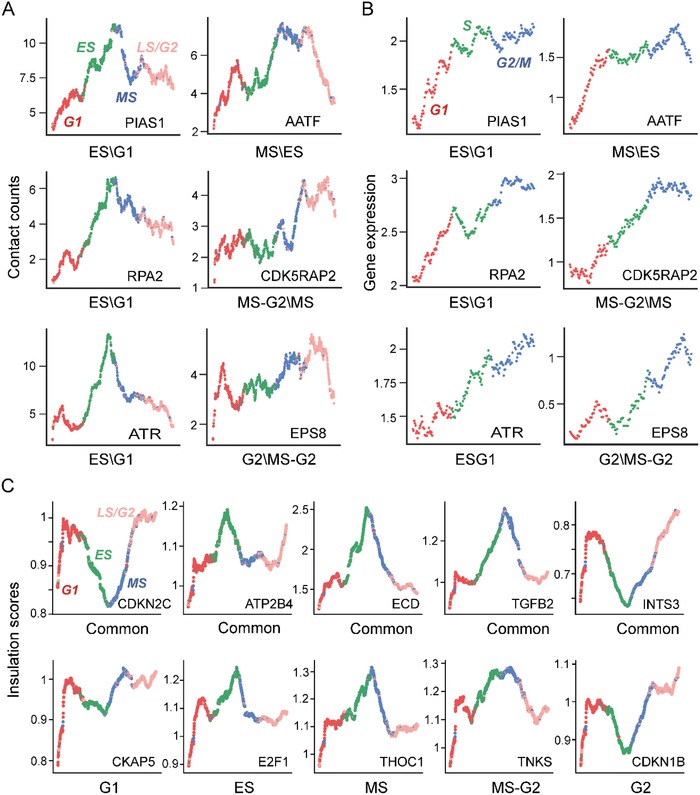
Figure 5.

Case studies of important regulatory genes at single‐cell resolution. A) Smoothed contact counts of differential loops overlapping with important regulatory genes across cell‐cycle progression at single‐cell resolution. The first subgraph demonstrates the four cycle phases of single cells with different colors (red: G1, green: MS, blue: MS, and pink: LS/G2). B) Smoothed gene expression corresponding to (A) across cell‐cycle progression at single‐cell resolution. The first subgraph demonstrates the three cycle phases of single cells with different colors (red: G1, green: S, and blue: G2/M). C) Smoothed insulation score of common and specific TAD boundaries overlapping with important regulatory genes across cell‐cycle progression at single‐cell resolution. The colors of cycle phases are consistent with (A) in the first subgraph.
