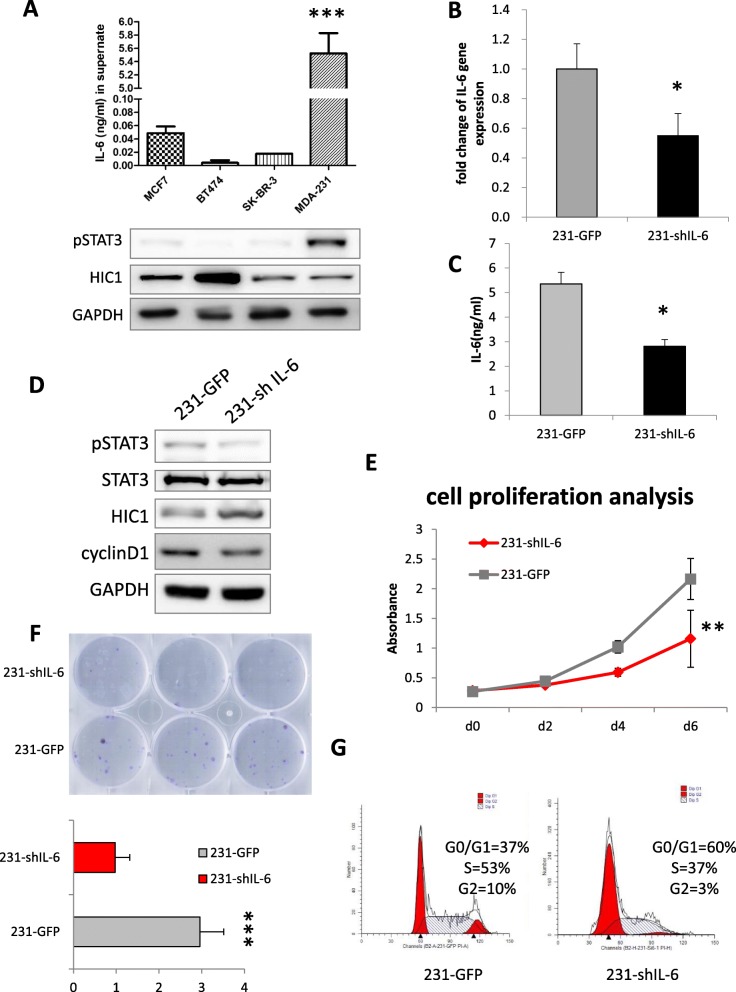
Fig. 5.
The IL-6/pSTAT3/HIC1 axis in MDA-MB-231 cells. ELISA results of secreted IL-6 and expression of pSTAT3 and HIC1 in the BrCA cell lines. b Real-time PCR was used to examine the IL-6 knockdown effect in MDA-MB-231 cells. c ELISA results to confirm the decreased expression of IL-6 in 231-shIL-6 cells. d HIC1 expression was increased in sh-IL-6 cells. e Cell viability assay in 231-shIL-6 cells for 2, 4 and 6 days. f Colony formation was decreased in 231-shIL-6 cells after 10 days. g Examination of the cell cycle by flow cytometry analysis in 231-shIL-6 cells

