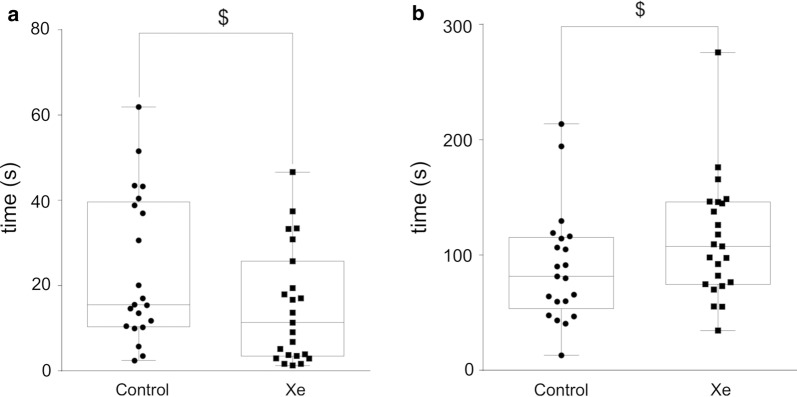
Fig. 4.
Performance of rats in forced swim test after acute Xe inhalation on pnd 35. Time spent immobile (in seconds) (a) and latency to first immobilization (in seconds) (b) were measured within 5 min observation. $—0.10 ≥ p ≥ 0.05 represent trend towards differences vs. Control group (Mann–Whitney U-test). Data are presented as box and whiskers plot. N = 21–23 rats/treatment

