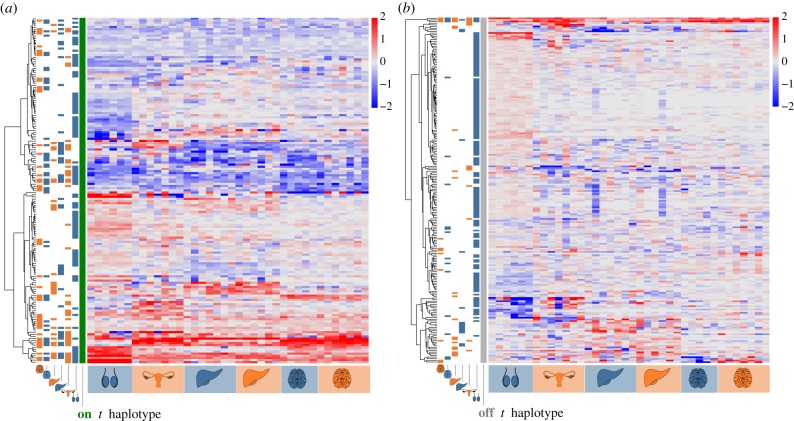
Figure 1.
Heatmaps indicating expression differences between +/t and +/+ males and females for all genes DE in at least one tissue, with red indicating increased expression and blue decreased expression in +/t. Each column indicates the comparison between a +/t mouse and its +/+ sibling, for gonads, liver and brain for males (blue) and females (orange). On the left of each panel, blue and orange bars indicate in which comparison a specific gene showed a significant gene-level expression difference: (a) with the green bar shows the genes located on the t haplotype, while (b) with the grey bar shows genes located in other genomic regions.

