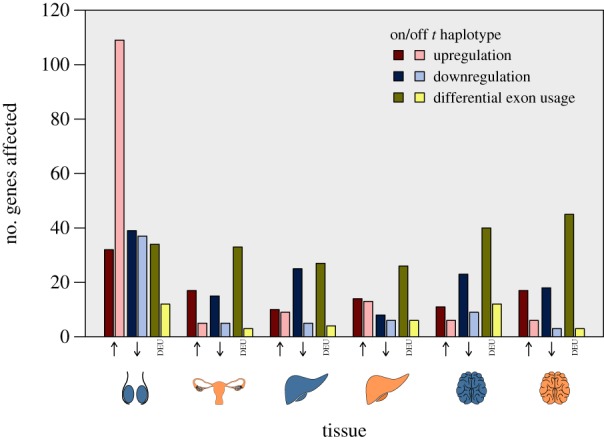
Figure 2.

The number of significantly DE genes per tissue and sex (with blue representing male tissue, and orange female tissue), grouped by up- or downregulation (indicated by up or down facing arrows) or DEU. Darker bars represent genes in the t haplotype region; lighter bars represent genes elsewhere in the genome.
