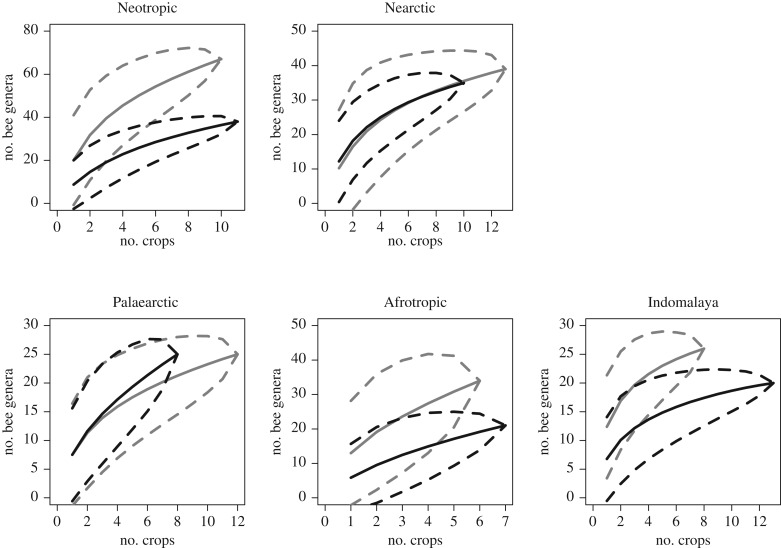
Figure 4.
Bee genus accumulation curves for each biogeographic realm. The y-axis shows the number of bee genera observed on flowers and the x-axis shows the number of crops studied. Solid grey lines are accumulation curves when native crops are sampled (grey dashed lines are 95% confidence bands), solid black lines are accumulation curves when exotic crops are sampled (black dashed lines are 95% confidence bands).

