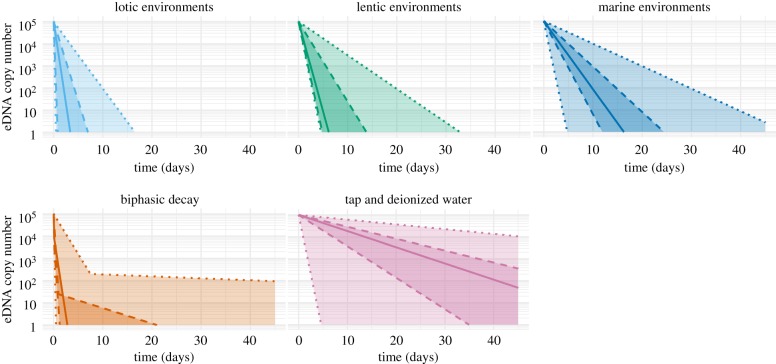
Figure 2.
Theoretical eDNA persistence over 45 days from an initial starting quantity of 105 copies, using decay constants derived from experimental studies, thereby illustrating the importance of considering ecosystem and model choice when predicting decay. Biphasic decay constants from both lentic and lotic ecosystems were combined, but bisphasic decay is likely to occur in marine and laboratory conditions as well. Solid lines indicate median decay constants (ordered by either T1/2 (monophasic models) or T99.99 (biphasic models)), dashed lines indicate quartile decay constants and dotted lines indicate extremes. Data from [26–28].

