

Abstract
The ‘social brain hypothesis' proposes a causal link between social complexity and either brain size or the size of key brain parts known to be involved in cognitive processing and decision-making. While previous work has focused on comparisons between species, how social complexity affects plasticity in brain morphology at the intraspecific level remains mostly unexplored. A suitable study model is the mutualist ‘cleaner’ fish Labroides dimidiatus, a species that removes ectoparasites from a variety of ‘client’ fishes in iterative social interactions. Here, we report a positive relationship between the local density of cleaners, as a proxy of both intra- and interspecific sociality, and the size of the cleaner's brain parts suggested to be associated with cognitive functions, such as the diencephalon and telencephalon (that together form the forebrain). In contrast, the size of the mesencephalon, rhombencephalon, and brain stem, assumed more basal in function, were independent of local fish densities. Selective enlargement of brain parts, that is mosaic brain adjustment, appears to be driven by population density in cleaner fish.
Keywords: brain size, mosaic brain, social brain hypothesis, sociality, cleaning mutualism, strategic sophistication
1. Introduction
There is substantial variation in brain size between vertebrate species, with absolute and/or relatively larger brains possessing ‘better’ cognitive abilities [1–6]. In addition, the artificial selection on brain enlargement is known to result in higher cognitive abilities in laboratory tests, such as discrimination learning in mice [7], and reversal-learning [8] and numerical abilities in female guppies [9]. Social and environmental complexity emerged as two competing hypotheses to explain how increased cognitive demands drive brain size evolution [10–16]. Comparative studies on the social brain hypothesis (SBH) identified either group size [10,11,14,17–20], mating systems [21–23], or social bonds [24,25] as proxies for the selective social pressure. In contrast, studies testing the environmental intelligence hypothesis focused on diet-related aspects such as home range size, general habitat complexity, and extractive foraging [13,15,26,27]. There is an ongoing debate regarding which of these hypotheses best explains brain size evolution [13,15,16]. An essential part of the challenge is the difficulty in validating a proxy for complexity (i.e. group size, diet, home range, etc.) as a predictor for cognitive performance and brain size in the studied species [16,19,28].
Furthermore, research investigating brain size evolution has focused on large-scale comparisons between species to address evolutionary questions [29–33]. As we reach the limits of this approach and until more refined data become available [31,34], a complementary approach may help to improve our understanding. One underexplored option is to investigate how variation in ecology affects brain anatomy within a population. The idea behind such an approach is that adaptation may be achieved either through genetic adaptation (evolutionary timescale) or through individual plasticity (ecological timescale) and that learning about selective factors in one timescale may inform about the other one, despite the different mechanisms underlying adaptation [35].
Fishes emerge as a promising study clade for the ecological timescale approach as they possess highly plastic brains in comparison to mammals [36]. Indeed, various studies show evidence for covariation in fish brain plasticity and either habitat features [37], migration, growth rules [38], and/or sensory system shifts during ontogenetic development [39,40]. However, only a few studies have explored the impact of the social environment on plasticity in the brain or brain part size. For example, cichlids (Neolamprologus pulcher) reared in large groups had a relatively larger hypothalamus and cerebellum compared to the ones reared in small groups [41]. Similarly, sticklebacks (Pungitius pungitius) reared in groups developed a larger optic tectum than those reared individually [42]. In guppies (Poecilia reticulata), rearing females and males in same sex or mixed sex pairs resulted in various sex-specific brain part size changes [43]. All these studies were conducted in the laboratory, whereas the effects of the social environment on brain plasticity remain unexplored under natural conditions.
The cleaner fish Labroides dimidiatus (hereafter ‘cleaner’) is a good study model to explore potential links between sociality and brain size in natural conditions. They have a well-studied intra- and interspecific social life: the population is female biased, and they typically live in harems (i.e. social groups) comprised of one male and several smaller females [44]. While male and female harem members cooperate in terms of joint reproduction, female harem members are also potential future competitors to the current male, because cleaners are protogynous hermaphrodites [44–46]. While not studied in cleaners, research on other species that change sex revealed that conflicts over dominance in a size-based hierarchy lead to strategic growth decisions to avoid aggression by dominants [47]. These aspects, taken together, suggest that the complexity of a cleaner's intraspecific social life will likely be a function of the population density.
Adding to the complexity, cleaners obtain almost 100% of their diet from interspecific social interactions with a variety of client reef fish (hereafter ‘client’) that visit the cleaners to have their ectoparasites removed [48,49]. Conflicts of interest arise between cleaners and their clients because cleaners prefer to eat clients' mucus instead of ectoparasites, an act that constitutes cheating [50]. Finding food is hence an interspecific social task, where cleaners have to find a balance between cooperation and conflict. Such a balance is necessary because clients employ various partner control mechanisms to reduce the cheating rates including switching to another cleaner for future inspections, punishment through aggressive chasing, and the attribution of a negative reputation (i.e. image-score) and hence avoidance upon witnessing a cheating event with a current client [51,52]. In turn, cleaners adjust their service quality to the client's control mechanisms [53–55]. Cleaners may also give service priority to clients with access to several cleaning stations (i.e. able to switch to another cleaner if made to wait) over clients with access to the local cleaner only [53]. In summary, cleaners show highly advanced levels of fine-tuning in terms of service quality depending on the situation. This ability to adjust behaviour flexibly to the specifics of a given situation has been termed high strategic sophistication [56]. In conclusion, cleaners do not face standard environmental foraging challenges like other species do, making it most parsimonious to attribute any effect of population density on brain anatomy to a change in intra- and/or interspecific social complexity.
Interestingly, variation has been documented in strategic behaviour (i.e. reputation management and service priority) among individual cleaners that belong to demes of the same population, ranging from low to high strategic sophistication [57]. Among various examined potential predictors, local cleaner population densities, or respectively the highly correlated population densities of all large client species combined, emerged as the best predictor for cleaner's strategic sophistication [58]. Assuming that densities correlate with the number of intra- and interspecific social interactions, and knowing that high densities promote increased strategic sophistication in cleaners, we used the cleaner population as a measure of sociality in cleaner fish [58]. As has been argued previously, differences in strategic sophistication are most likely based on individual proximate adjustments as cleaner fish have a pelagic egg and larval stage with little choice for settlement [59,60], promoting gene structure homogenization between populations [61]. Furthermore, juvenile cleaners from sites differing in their cleaner population densities showed homogeneous poor strategic sophistication [57]. Thus, any potential differences in brain size would also be most likely based on plastic adjustments.
We collected cleaners from sites differing in their cleaner density and then quantified their brain morphology. This allowed us to explore the potential links between population density and brain size in a wild species. Based on the SBH [62], we predicted that increased population density of cleaner fish could be reflected in increased brain size. We considered the following two scenarios: first, the entire brain might become enlarged in response to high population density. Second, mosaic brain development might increase brain size through a selective enlargement of key brain parts, while other brain parts remain unchanged [63]. Here, we suggest that these key brain parts will be the telencephalon and the diencephalon (which together form the forebrain); together they harbour the limbic system involved in regulating social behaviour in fish [64,65]. More specifically, they regulate complex functions such as feeding, motivation, memory, sexual behaviour, territoriality, fear conditioning, spatial learning, and decision-making [66–69]. Also, from an evolutionary perspective, the mammalian neocortex is a telencephalic structure. Despite the morphological divergence, comparative studies show that the fish telencephalon and mammalian neocortex share some conserved gene expression networks [66,70].
2. Methods
(a). Field site and fish survey
We conducted the study on Lizard Island (14.6682° S, 145.4604° E), Great Barrier Reef, Australia, between July and August 2016. Scuba divers conducted an underwater fish survey at four different reef sites: Mermaid Cove, Northern Horseshoe, Horseshoe, and Bird Islet (see electronic supplementary material, figure S1 for the specific reef locations). Observers counted the abundance of adult cleaner fish Labroides dimidiatus and their client coral fishes on transect lines. We collected up to 10 replicates of transects of 30 m each at every study site. We recorded the large-bodied fish (total length (TL) > 10 cm) and cleaners on a 5 m width, and small-bodied fish (TL ≤ 10 cm) on a 1 m wide area along the 30 m transect. We then scaled all counts to densities per 100 m2 (methods followed Triki et al. [58]).
(b). Study animals
We caught cleaners at both Mermaid Cove and Northern Horseshoe upon completing fish surveys. At Horseshoe and Bird Islet locations, however, we collected cleaner fish two weeks before the surveys due to time constraints. In total, we collected 20 adult female cleaner wrasse from these study sites. We studied only females here because they are much more abundant than males [44], and also to be able to follow up on the studies by Wismer et al. [57] and Triki et al. [56,58] conducted on female cleaners. For the fish capture, we used a barrier net (size of the net: 2 × 1 m, 5 mm mesh size) and hand nets. Then, we housed fish in individual aquaria of size (62 × 27 × 37 cm) and provided them with polymerizing vinyl chloride (PVC) pipes (10 cm × 1 cm) as shelter. We fed the fish daily with a paste of mashed prawn smeared on Plexiglas plates (8 × 15 cm), and they all fed successfully off the Plexiglas plates upon the first two days of acclimation.
(c). Magnetic resonance imaging scans
Brain samples were from the 20 caught adult female cleaner wrasse (TL: mean ± s.d., 7.38 ± 0.71 cm) (five cleaners from Mermaid Cove, one from Northern Horseshoe, seven from Bird Islet, and seven from Horseshoe). We sacrificed the cleaners by a rapid cervical transection. Immediately after, we immersed the whole heads in a fixing solution of 4% paraformaldehyde (PFA). We then dissected the brains under a stereomicroscope Zeiss steREO Discovery.V8 with a zoom set at 7 : 1. We kept the brains in the braincase but removed the surrounding tissue and bones. Also, we made a small breach on the rostral end of the brain. This facilitated the filtration of the fixative to the brain tissue. After a period of 24 h in the PFA at room temperature, we transferred the specimens to a phosphate-buffered solution (PBS). Afterwards, we transported the samples to the Queensland Brain Institute (QBI) for magnetic resonance imaging (MRI). Overall, the samples stayed in PBS for 48 h before we transferred them into a gadolinium-based contrast agent of 0.2% Magnevist®. We incubated the samples at 4°C in a Magnevist® solution of 10× the volume of the sample for 10 days. Also, we renewed the Magnevist® solution on day 5 of the incubation.
We scanned the fish brains with a Bruker Avance 16.4T MRI spectrometer. They were scanned using a 15 mm surface acoustic wave (SAW) coil, and micro 2.5 gradient. We employed the following parameters for the scanning: 3D gradient echo FLASH sequence, with repetition time (TR)/echo time (TE) = 50/8 ms, number of excitations (NEX) = 8, flip angle of 30°, field-of-view = 31 × 12 × 10 mm, bandwidth of 100 kilohertz (KHz), and matrix size = 1028 × 400 × 330 providing an image resolution of 30 µm3 isotropic voxels. Total image acquisition was 8 h 16 min. We ran the 20 brains in four rounds of scan; wherein we scanned five brains per round. To do so, we glued every five brains on a small plastic sheet (6 × 1.5 × 0.3 cm): three brains on one side and two on the other side of the plastic sheet. This spatial distribution helped to identify the brains in the scans (see electronic supplementary material, figure S3).
(d). Image processing
We analysed and rendered the brain images by using the software Amira® version 6.0. We performed the delineation manually, image-by-image, first on frontal sections, then corrected and confirmed on the sagittal and transversal sections. We used two cichlid fish brain atlases as a reference in the brain parts delineation process: the Oreochromis mossambicus [71] and Astatotilapia burtoni (HA Hofmann 2016, personal communication). Experimenters were blind to the identity of the samples during image analyses. In total, we segmented the brains into five main brain parts or divisions: telencephalon, diencephalon, mesencephalon, rhombencephalon, and brain stem (figure 1). We preferred to delineate the major brain divisions and avoided segmenting subdivisions of the main five parts. We focused on gross brain regions because the resolution was insufficient to conduct volumetric analyses at a finer level.
Figure 1.

The Labroides dimidiatus brain. (a) A representative magnetic resonance imaging (MRI) scan image of a sagittal section of L. dimidiatus brain inside its braincase, the lower panel shows the delineation of the five brain structures: telencephalon including the olfactory bulb (in red), diencephalon (in green), mesencephalon (in blue), rhombencephalon (in yellow), brain stem (in orange). Images generated with OsiriX Lite® v. 9.5.2. Cleaner fish photo credit to Z. T. (b) A 3D brain rendering showing the main brain parts from four different angles of the brain: top left image shows a partial frontal view, top right image shows a lateral view, bottom left image shows a superior view, and bottom right shows a dorsal view. The brain is subdivided into six major brain areas, depicted in different colours: telencephalon (in red), olfactory bulbs (in pink), diencephalon (in green), mesencephalon (in blue), rhombencephalon (in yellow), and brain stem (in light blue). Images were prepared with the AMIRA software by E. L. (Online version in colour.)
The image processing indicated that several of the samples (i.e. 19 out of 20) had a slightly damaged frontal part of the telencephalon which occurred during the brain dissection (see electronic supplementary material, figures S3 and S4). This also made it difficult to delineate the olfactory bulb from the telencephalon. We still obtained an estimate of telencephalon size (including the olfactory bulb) for 15 out of the 20 brains from the MRI scans. We used the global brain scan images to estimate the relative size of the damaged area, which varied between 0 and 70% (median 30%). The estimate was made blind to the identity of the sample. Two statistical tests indicated that the data remains valid. First, there were no systematic differences between telencephalons collected at different sites with respect to estimated damage (ANOVA, d.f. = (1, 13), F = 1.05, p = 0.38). Second, we did not find any correlation between estimated damage and telencephalon volume (ANOVA, d.f. = (1, 13), F = 0.27, p = 0.61). Therefore, we added a few statistical tests involving the telencephalon part (see results).
(e). Data analyses
Most brain morphology analyses tend to standardize the brain or brain part size to body size measures like length or weight [72–74]. This approach aims to correct for the brain portion responsible for body maintenance, thus facilitating the comparison of the brain component supposedly linked to the various cognitive processes [1,75,76]. An alternative practice is to scale brain part sizes to either the whole brain or the other brain parts instead of body size (i.e. size ratio) [77]. This scaling method, contrary to body size scaling, allows exploration of potential selective enlargement in key brain zones depending on their functionality [35]. We used this method as a measurement for the mosaic brain development hypothesis, wherein some brain parts might selectively grow bigger while the rest of the brain remains unchanged [63]. As scaling to either body size or other brain parts address different questions regarding brain morphology [78], here we used both scaling methods on the same dataset to provide a complete picture of brain morphology.
In the first scaling method to body size, we extracted the residuals of the regression slope of log-transformed brain part sizes (in mm3) on log-transformed body weight (in g). In the second scaling method to either the rest of the brain size or to another brain part, no log transformation was needed at this stage. Multivariate analysis of variance (MANOVA) allowed for multiple hypotheses testing. Upon a significant MANOVA outcome (significance threshold set at alpha ≤ 0.05), we ran separate univariate ANOVA for each dependent variable. Brain measurements were fitted as the response variable, while cleaner density was fitted as a categorical predictor with three levels of density recordings (0.47, 0.83, and 1.6 cleaner per 100 m2, see results). We ran post hoc analyses of significant ANOVAs with the function emmeans() from the package emmeans in R language. We then verified models' assumptions, such as normal distribution and homogeneity of variance of the residuals, with statistical tests and visual plots. We ran all statistical analyses and generated the figures with the software R version 3.3.2 (2016-10-31).
3. Results
The four locations had the following cleaner population sizes: mean ± s.d.; 0.47 ± 0.63 cleaner per 100 m2 at Mermaid Cove, 0.47 ± 0.7 at Northern Horseshoe, 0.83 ± 0.92 at Horseshoe, and 1.6 ± 1.1 at Bird Islet. This created three levels of average cleaner densities 0.47, 0.83, and 1.6 (electronic supplementary material, figure S2).
We first tested whether the residuals of the log-transformed total size of four measured brain parts; diencephalon, mesencephalon, rhombencephalon, and brain stem, on log-transformed body size (see electronic supplementary material, figure S5) were affected by the cleaner density at the study sites. We found no significant relationship for cleaner density and overall size of the four brain parts (ANOVA: n = 20, F = 0.285, d.f. = (2, 17), p = 0.756). Nevertheless, by fitting the residuals of the log of the four brain parts on log body size in a MANOVA, we found a significant effect of cleaner density (MANOVA: n = 20, d.f. = (2, 8), F = 2.326, p = 0.045). With univariate analyses as post hoc tests, we found no significant relationship between cleaner density and either of the four brain parts (table 1, figure 2).
Table 1.
Summary statistics of univariate analyses following the multivariate analysis of variance (MANOVA) tests. Values in bold indicate significant effect (alpha set at ≤ 0.05).
|
effect size |
95% confidence level |
||||||||
|---|---|---|---|---|---|---|---|---|---|
| response variable | degree of freedom (d.f.) | F-value | p-value | adjusted R2 | predictor levels | mean | s.e. | lower | upper |
| brain part sizes | |||||||||
| residuals of log diencephalon size on log body size | 2, 17 | 1.732 | 0.2067 | 0.07 | cleaner density 0.47 | −0.029 | 0.043 | −0.119 | 0.062 |
| cleaner density 0.83 | −0.035 | 0.040 | −0.119 | 0.049 | |||||
| cleaner density 1.6 | 0.060 | 0.040 | −0.024 | 0.144 | |||||
| residuals of log mesencephalon size on log body size | 2, 17 | 0.0045 | 0.995 | −0.11 | cleaner density 0.47 | 0.003 | 0.034 | −0.069 | 0.075 |
| cleaner density 0.83 | −0.001 | 0.032 | −0.068 | 0.066 | |||||
| cleaner density 1.6 | −0.001 | 0.032 | −0.068 | 0.066 | |||||
| residuals of log rhombencephalon size on log body size | 2, 17 | 0.077 | 0.926 | −0.10 | cleaner density 0.47 | 0.006 | 0.050 | −0.098 | 0.111 |
| cleaner density 0.83 | −0.014 | 0.046 | −0.111 | 0.082 | |||||
| cleaner density 1.6 | 0.009 | 0.046 | −0.088 | 0.106 | |||||
| residuals of log brain stem size on log body size | 2, 17 | 0.791 | 0.469 | −0.02 | cleaner density 0.47 | 0.049 | 0.046 | −0.049 | 0.146 |
| cleaner density 0.83 | −0.022 | 0.043 | −0.112 | 0.069 | |||||
| cleaner density 1.6 | −0.020 | 0.043 | −0.111 | 0.070 | |||||
| pairwise comparisons of brain parts | |||||||||
| ratio of diencephalon to mesencephalon | 2, 17 | 7.981 | 0.003 | 0.42 | cleaner density 0.47 | 1.100 | 0.032 | 1.029 | 1.160 |
| cleaner density 0.83 | 1.060 | 0.030 | 0.994 | 1.120 | |||||
| cleaner density 1.6 | 1.220 | 0.030 | 1.155 | 1.280 | |||||
| ratio of diencephalon to rhombencephalon | 2, 17 | 6.7767 | 0.007 | 0.38 | cleaner density 0.47 | 1.510 | 0.034 | 1.440 | 1.580 |
| cleaner density 0.83 | 1.510 | 0.031 | 1.440 | 1.580 | |||||
| cleaner density 1.6 | 1.650 | 0.031 | 1.590 | 1.720 | |||||
| ratio of diencephalon to brain stem | 2, 17 | 19.292 | <0.001 | 0.66 | cleaner density 0.47 | 2.600 | 0.057 | 2.480 | 2.720 |
| cleaner density 0.83 | 2.730 | 0.053 | 2.620 | 2.840 | |||||
| cleaner density 1.6 | 3.060 | 0.053 | 2.950 | 3.170 | |||||
| ratio of mesencephalon to rhombencephalon | 2, 17 | 0.875 | 0.435 | −0.01 | cleaner density 0.47 | 1.380 | 0.040 | 1.300 | 1.470 |
| cleaner density 0.83 | 1.430 | 0.037 | 1.350 | 1.510 | |||||
| cleaner density 1.6 | 1.360 | 0.037 | 1.290 | 1.440 | |||||
| ratio of mesencephalon to brain stem | 2, 17 | 1.649 | 0.222 | 0.06 | cleaner density 0.47 | 2.390 | 0.082 | 2.220 | 2.560 |
| cleaner density 0.83 | 2.590 | 0.076 | 2.430 | 2.750 | |||||
| cleaner density 1.6 | 2.530 | 0.076 | 2.370 | 2.690 | |||||
| ratio of brain stem to rhombencephalon | 2, 17 | 2.370 | 0.124 | 0.12 | cleaner density 0.47 | 0.581 | 0.014 | 0.552 | 0.609 |
| cleaner density 0.83 | 0.553 | 0.013 | 0.527 | 0.580 | |||||
| cleaner density 1.6 | 0.541 | 0.013 | 0.515 | 0.568 | |||||
Figure 2.

Relationship of residuals from brain part sizes on body size and cleaner density. Box plots of median, interquartile range, upper and lower quartiles, and outliers. The raw data are depicted as dark red dots. (Online version in colour.)
By analysing the size ratio of the diencephalon to the other three brain parts combined (i.e. mesencephalon, rhombencephalon, and brain stem), we found significant differences between the three cleaner densities at the study sites (ANOVA: n = 20, F = 15.34, d.f. = (2, 17), p < 0.001, adjusted R2 = 0.60). Post hoc test showed that diencephalon size ratio at the highest cleaner density 1.6 was significantly higher than the other two cleaner densities, 0.47 and 0.83 cleaner per 100 m2 (figure 3).
Figure 3.
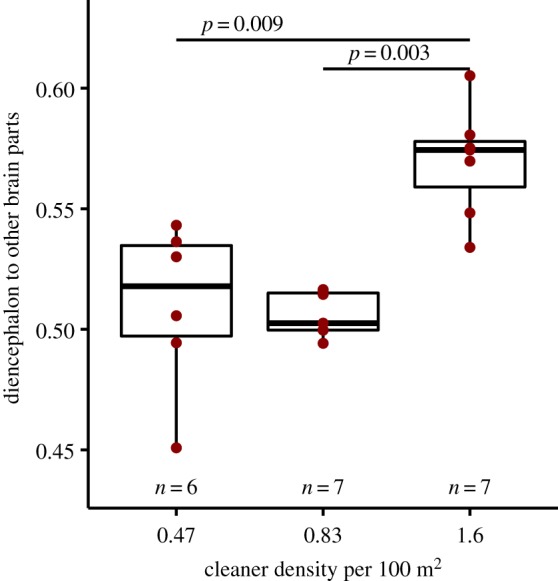
Relationship of the diencephalon size ratio to the rest of the brain and cleaner density. Box plots of median, interquartile range, upper and lower quartiles, and outliers. The raw data are depicted as dark red dots. p-values are estimated with post hoc analysis run on significant overall effect. (Online version in colour.)
We also used another scaling method by estimating the size ratio of every brain part to another brain part. Here, we also found a significant effect of cleaner density (MANOVA: n = 20, d.f. = (2, 12), F = 2.469, p = 0.02, figure 4). By running univariate post hoc tests, we found that the diencephalon was relatively larger than any of the other three brain parts (p ≤ 0.01, table 1). Among the size ratios of the remaining three brain parts to each other (i.e. mesencephalon, rhombencephalon, and brain stem), however, there was no significant effect of cleaner density (table 1).
Figure 4.

Pairwise comparisons of brain part sizes and their relationship with cleaner density. Box plots of median, interquartile range, upper and lower quartiles, and outliers of size ratio between diencephalon and (a) mesencephalon, (b) rhombencephalon, and (c) brain stem; and ratio between mesencephalon and (d) rhombencephalon, and (e) brain stem; and (f) ratio between brain stem and rhombencephalon. The raw data are depicted as dark red dots. p-values are estimated with post hoc analysis run on significant overall effects. (Online version in colour.)
We also tested the relationship between residuals of the log telencephalon size on log body size and cleaner density despite the potential inaccuracy of the telencephalon data. There was no significant effect of cleaner density (ANOVA: n = 15, d.f. = (2, 12), F = 1.481, p = 0.266, figure 5a). In addition, cleaner density did not significantly impact the size ratio of the telencephalon to the combined size of mesencephalon, rhombencephalon, and brain stem (ANOVA: n = 15, d.f. = (2, 12), F = 1.934, p = 0.187, figure 5b), as well as the telencephalon to diencephalon ratio (ANOVA: n = 15, d.f. = (2, 12), F = 1.098, p = 0.365, figure 5c). However, the forebrain size ratio, estimated from the telencephalon and diencephalon size ratio to the rest of the brain, showed a significant effect of cleaner density (ANOVA: n = 15, d.f. = (2, 12), F = 5.712, p = 0.018, adjusted R2 = 0.40, figure 5d).
Figure 5.

Relationship of brain measurements, involving the telencephalon data, and cleaner density. Box plots of median, interquartile range, upper and lower quartiles, and outliers of (a) residuals of telencephalon size on body size, (b) telencephalon size ratio to mesencephalon + rhombencephalon + brain stem combined, (c) ratio between telencephalon and diencephalon, and (d) forebrain size ratio as an estimate of telencephalon + diencephalon/mesencephalon + rhombencephalon + brain stem. The raw data are depicted as dark red dots. p-values are estimated with post hoc analysis run on significant overall effect. (Online version in colour.)
4. Discussion
The current study extends previous laboratory research [41,43] by documenting that natural variation in local population density correlates positively with cleaner fish forebrain size relative to the rest of the brain: this ratio being on average 14% higher when cleaner density doubled. In contrast, forebrain size scaled to body size did not vary as a function of fish densities. Taken together, the results suggest a mosaic brain development that allows cleaners to enlarge key brain parts as a response to the social environment.
Since brains are energetically demanding [79,80], it is supposedly less costly to selectively enlarge key brain parts instead of enlarging the entire brain. Accordingly, the SBH predicts that key brain parts involved in regulating social behaviour, such as the neocortex in mammals, may have been selectively enlarged as a response to the selection pressures of complex social cues [10,12,20,81]. As the fish forebrain has also been shown to play a major role in social decision-making [65], our results support the SBH. While our telencephalon size estimates were potentially less reliable due to potential artefacts introduced during sample preparation (see electronic supplementary material, figure S5), the diencephalon showed a strong signal. It suggests that diencephalon size was selectively enlarged due to its key functions in regulating social behaviour and decision-making. Indeed, the diencephalon harbours several neuronal nuclei that regulate social behaviour in fish [64,65]. These include the preoptic area and its role in regulating aggressive and reproductive behaviours [82], and the hypothalamus and its regulation of the neuroendocrine pathways known for their major role in underpinning social behaviours like affiliative behaviour, reproduction, aggression, territoriality [83], and food intake [84].
We had taken cleaner fish densities as an indicator of both intraspecific and interspecific social complexity, as previous research had shown that cleaner densities and large client densities are highly correlated [58]. High densities are a requirement for the emergence of cleaners showing high strategic sophistication in interactions with clients, like increasing service quality when observed and giving service priority to clients with access to other cleaners [58]. Regarding intraspecific interactions, it seems logical that higher cleaner densities lead to more social interactions with a greater number of other cleaners. Such interactions include aggressive encounters when cleaners defend their territory against intruding conspecifics [85], or males checking their harem females to prevent those from changing sex and become a competitor [45]. As an adaptation to a size-based hierarchy, female cleaners have to adjust their growth strategically as documented for coral-dwelling gobies that queue for breeder position [47]. At this stage, the relative importance of intra- versus interspecific interactions on brain part development remains an open question. The strategic sophistication of cleaners regarding key aspects of interactions with clients was very low during our study period as cleaner fish populations were reduced by 80%, which took place four months after the onset of the 2016 El Niño event [56,86]. This low performance prevented any analyses of how individual performance links to brain measures. Therefore, experiments that link population densities, individual performance, and brain part size in cleaners are currently lacking.
The SBH was initially developed to explain why monkeys and apes have relatively large brains compared to other mammalian clades [75] as well as the variation in relative brain size within clades [10]. In the original analysis, group size was used as a proxy for social complexity, while neocortex ratio emerged as the brain measure that yielded the highest correlation with group size, suggesting that it was a better estimate of intelligence than relative brain size [75]. The hypothesis was soon successfully applied to bats and carnivores [87]. Despite its initial success, the SBH is now viewed with more scepticism for two main reasons: on a more technical level, various studies found supporting evidence only if group size and neocortex ratio were replaced with other measures [19,31,63,78,88,89] thus introducing arbitrary factors in the analyses. On a conceptual level, some studies aiming to test whether social, environmental, or general intelligence predict best brain size variation [12,14,90] conclude that social intelligence does not explain most of the variance. The challenge for all evolutionary analyses is that comparing different species introduces unexplained variation, partially due to the many ecological factors that are not considered in brain analyses. In contrast, the present study facilitates the elimination of many of these uncertainties by comparing individuals of the same species. The sampled cleaners belonged to the same gene pool, and cleaners have a unique foraging niche as they obtain food from interspecific social interactions. Therefore, both intraspecific and interspecific (i.e. foraging) interactions are social ‘games’ wherein individuals manoeuvre between cooperation and conflict. Our main result that living with more social partners (i.e. the equivalent of being in a larger group) is correlated with a relatively larger forebrain (i.e. the equivalent of the neocortex ratio) fits the initial analyses and results of the SBH.
In conclusion, it appears that relative enlargement of the forebrain might be a direct consequence of social challenges during the lifetime of individuals. The results thus fit an ontogenetic version of the otherwise evolutionarily formulated SBH. In this view, high numbers of intra- and interspecific social interactions would stimulate neuronal plasticity of the forebrain in these fish, similar to the effects of enrichment on laboratory-raised mammals [91]. A remaining challenge for future research will be to bring ontogenetic and evolutionary timescales together into a single coherent framework.
Supplementary Material
Acknowledgements
We kindly thank the staff of Lizard Island Research Station for their support and friendship. We also thank N. Kurniawan for his assistance with the MRI scanner, D. Roche for his field support and R. Slobodeanu for the statistical consulting.
Ethics
All work was performed under The Animal Ethics Committee of the Queensland government (DAFF) approval number (CA 2016/05/970).
Data accessibility
Data used in the study and the script for statistical analyses and generating figures are available as part of the electronic supplementary material.
Authors' contributions
Z.T., R.B., and J.M. conceived the idea; Z.T. and R.B. designed the study; Z.T. and E.L. collected the laboratory data; E.L. and W.M. analysed the MRI scans with input from Z.T.; Z.T. analysed the data and generated the figures. Z.T. and R.B. wrote and finalized the paper with input from all authors.
Competing interests
All authors declare no competing interests.
Funding
Funding was provided by the Swiss National Science Foundation (grant no. 310030B_173334/1 to R.B.).
References
- 1.Jerison H. 1973. Evolution of the brain and intelligence. New York, NY: Academic Press. [Google Scholar]
- 2.Deaner RO, Isler K, Burkart J, van Schaik C. 2007. Overall brain size, and not encephalization quotient, best predicts cognitive ability across non-human primates. Brain Behav. Evol. 70, 115–124. ( 10.1159/000102973) [DOI] [PubMed] [Google Scholar]
- 3.Reader SM, Hager Y, Laland KN. 2011. The evolution of primate general and cultural intelligence. Phil. Trans. R. Soc. B 366, 1017–1027. ( 10.1098/rstb.2010.0342) [DOI] [PMC free article] [PubMed] [Google Scholar]
- 4.Benson-Amram S, Dantzer B, Stricker G, Swanson EM, Holekamp KE. 2016. Brain size predicts problem-solving ability in mammalian carnivores. Proc. Natl Acad. Sci. USA 113, 2532–2537. ( 10.1073/pnas.1505913113) [DOI] [PMC free article] [PubMed] [Google Scholar]
- 5.MacLean EL, et al. 2014. The evolution of self-control. Proc. Natl Acad. Sci. USA 111, E2140–E2148. ( 10.1073/pnas.1323533111) [DOI] [PMC free article] [PubMed] [Google Scholar]
- 6.Rumbaugh DM, Savage-Rumbaugh ES, Washburn DA. 1996. Toward a new outlook on primate learning and behavior: complex learning and emergent processes in comparative perspective. Jpn. Psychol. Res. 38, 113–125. ( 10.1111/j.1468-5884.1996.tb00016.x) [DOI] [PubMed] [Google Scholar]
- 7.Wimer C, Prater L. 1966. Some behavioral differences in mice genetically selected for high and low brain weight. Psychol. Rep. 19, 675–681. ( 10.2466/pr0.1966.19.3.675) [DOI] [PubMed] [Google Scholar]
- 8.Buechel SD, Boussard A, Kotrschal A, van der Bijl W, Kolm N.. 2018. Brain size affects performance in a reversal-learning test. Proc. R. Soc. B 285, 20172031 ( 10.1098/rspb.2017.2031) [DOI] [PMC free article] [PubMed] [Google Scholar]
- 9.Kotrschal A, Rogell B, Bundsen A, Svensson B, Zajitschek S, Brännström I, Immler S, Maklakov AA, Kolm N. 2013. Artificial selection on relative brain size in the guppy reveals costs and benefits of evolving a larger brain. Curr. Biol. 23, 168–171. ( 10.1016/j.cub.2012.11.058) [DOI] [PMC free article] [PubMed] [Google Scholar]
- 10.Dunbar RIM. 1992. Neocortex size as a constraint on group size in primates. J. Hum. Evol. 22, 469–493. ( 10.1016/0047-2484(92)90081-J) [DOI] [Google Scholar]
- 11.Barton RA. 1996. Neocortex size and behavioural ecology in primates. Proc. R. Soc. Lond. B 263, 173–177. ( 10.1098/rspb.1996.0028) [DOI] [PubMed] [Google Scholar]
- 12.Reader SM, Laland KN. 2002. Social intelligence, innovation, and enhanced brain size in primates. Proc. Natl Acad. Sci. USA 99, 4436–4441. ( 10.1073/pnas.062041299) [DOI] [PMC free article] [PubMed] [Google Scholar]
- 13.DeCasien AR, Williams SA, Higham JP. 2017. Primate brain size is predicted by diet but not sociality. Nat. Ecol. Evol. 1, 112 ( 10.1038/s41559-017-0112) [DOI] [PubMed] [Google Scholar]
- 14.Street SE, Navarrete AF, Reader SM, Laland KN. 2017. Coevolution of cultural intelligence, extended life history, sociality, and brain size in primates. Proc. Natl Acad. Sci. USA 114, 7908–7914. ( 10.1073/pnas.1620734114) [DOI] [PMC free article] [PubMed] [Google Scholar]
- 15.González-Forero M, Gardner A. 2018. Inference of ecological and social drivers of human brain-size evolution. Nature 557, 554–557. ( 10.1038/s41586-018-0127-x) [DOI] [PubMed] [Google Scholar]
- 16.van Schaik CP, Isler K, Burkart JM.. 2012. Explaining brain size variation: from social to cultural brain. Trends Cogn. Sci. 16, 277–284. ( 10.1016/j.tics.2012.04.004) [DOI] [PubMed] [Google Scholar]
- 17.Dunbar RIM. 1993. Coevolution of neocortical size, group size and language in humans. Behav. Brain Sci. 16, 681 ( 10.1017/S0140525X00032325) [DOI] [Google Scholar]
- 18.Kudo H, Dunbar RIM. 2001. Neocortex size and social network size in primates. Anim. Behav. 62, 711–722. ( 10.1006/anbe.2001.1808) [DOI] [Google Scholar]
- 19.Beauchamp G, Fernández-Juricic E. 2004. Is there a relationship between forebrain size and group size in birds? Evol. Ecol. Res. 6, 833–842. [Google Scholar]
- 20.Shultz S, Dunbar RIM. 2006. Both social and ecological factors predict ungulate brain size. Proc. R. Soc. B 273, 207–215. ( 10.1098/rspb.2005.3283) [DOI] [PMC free article] [PubMed] [Google Scholar]
- 21.Pawłowski B, Lowen CB, Dunbar RIM. 1998. Neocortex size, social skills and mating success in primates. Behaviour 135, 357–368. ( 10.1163/156853998793066285) [DOI] [Google Scholar]
- 22.Iwaniuk AN. 2001. Interspecific variation in sexual dimorphism in brain size in Nearctic ground squirrels (Spermophilus spp.). Can. J. Zool. 79, 759–765. ( 10.1139/cjz-79-5-759) [DOI] [Google Scholar]
- 23.Barton RA. 2006. Olfactory evolution and behavioral ecology in primates. Am. J. Primatol. 68, 545–558. ( 10.1002/ajp.20251) [DOI] [PubMed] [Google Scholar]
- 24.Dunbar RIM, Shultz S. 2007. Evolution in the social brain. Science 317, 1344–1347. ( 10.1126/science.1145463) [DOI] [PubMed] [Google Scholar]
- 25.Emery NJ, Seed AM, von Bayern AMP, Clayton NS. 2007. Cognitive adaptations of social bonding in birds. Phil. Trans. R. Soc. B 362, 489–505. ( 10.1098/rstb.2006.1991) [DOI] [PMC free article] [PubMed] [Google Scholar]
- 26.Iwaniuk AN, Nelson JE. 2001. A comparative analysis of relative brain size in waterfowl (Anseriformes). Brain Behav. Evol. 57, 87–97. ( 10.1159/000047228) [DOI] [PubMed] [Google Scholar]
- 27.Clutton-Brock TH, Harvey PH. 1977. Primate ecology and social organization. J. Zool. 183, 1–39. ( 10.1111/j.1469-7998.1977.tb04171.x) [DOI] [Google Scholar]
- 28.Boucherie PH, Loretto M-C, Massen JJM, Bugnyar T. 2019. What constitutes ‘social complexity’ and ‘social intelligence’ in birds? Lessons from ravens. Behav. Ecol. Sociobiol. 73, 12 ( 10.1007/s00265-018-2607-2) [DOI] [PMC free article] [PubMed] [Google Scholar]
- 29.White GE, Brown C. 2015. Microhabitat use affects brain size and structure in intertidal gobies. Brain Behav. Evol. 85, 107–116. ( 10.1159/000380875) [DOI] [PubMed] [Google Scholar]
- 30.Gonda A, Herczeg G, Merilä J. 2013. Evolutionary ecology of intraspecific brain size variation: a review. Ecol. Evol. 3, 2751–2764. ( 10.1002/ece3.627) [DOI] [PMC free article] [PubMed] [Google Scholar]
- 31.Logan CJ, et al. 2018. Beyond brain size: uncovering the neural correlates of behavioral and cognitive specialization. Comp. Cogn. Behav. Rev. 13, 55–90. ( 10.3819/CCBR.2018.130008) [DOI] [Google Scholar]
- 32.van der Bijl W, Kolm N. 2016. Why direct effects of predation complicate the social brain hypothesis. Bioessays 38, 568–577. ( 10.1002/bies.201500166) [DOI] [PubMed] [Google Scholar]
- 33.Holekamp KE, Sakai ST, Lundrigan BL. 2007. Social intelligence in the spotted hyena (Crocuta crocuta). Phil. Trans. R. Soc. B 362, 523–538. ( 10.1098/rstb.2006.1993) [DOI] [PMC free article] [PubMed] [Google Scholar]
- 34.Tsuboi M, et al. 2018. Breakdown of brain–body allometry and the encephalization of birds and mammals. Nat. Ecol. Evol. 2, 1492–1500. ( 10.1038/s41559-018-0632-1) [DOI] [PubMed] [Google Scholar]
- 35.Striedter GF. 2006. Précis of principles of brain evolution. Behav. Brain Sci. 29, 1–12. ( 10.1017/S0140525X06009010) [DOI] [PubMed] [Google Scholar]
- 36.Kotrschal K, Van Staaden MJ, Huber R.. 1998. Fish brains: evolution and anvironmental relationships. Rev. Fish Biol. Fish. 8, 373–408. ( 10.1023/A:1008839605380) [DOI] [Google Scholar]
- 37.Kihslinger RL, Nevitt GA. 2006. Early rearing environment impacts cerebellar growth in juvenile salmon. J. Exp. Biol. 209, 504–509. ( 10.1242/jeb.02019) [DOI] [PubMed] [Google Scholar]
- 38.Kolm N, Gonzalez-Voyer A, Brelin D, Winberg S. 2009. Evidence for small scale variation in the vertebrate brain: mating strategy and sex affect brain size and structure in wild brown trout (Salmo trutta). J. Evol. Biol. 22, 2524–2531. ( 10.1111/j.1420-9101.2009.01875.x) [DOI] [PubMed] [Google Scholar]
- 39.Lisney TJ, Bennett MB, Collin SP. 2007. Volumetric analysis of sensory brain areas indicates ontogenetic shifts in the relative importance of sensory systems in elasmobranchs. Raffles Bull. Zool. 55(Supp. 14), 7–15. [Google Scholar]
- 40.Wagner H-J. 2003. Volumetric analysis of brain areas indicates a shift in sensory orientation during development in the deep-sea grenadier Coryphaenoides armatus. Mar. Biol. 142, 791–797. ( 10.1007/s00227-002-0990-7) [DOI] [Google Scholar]
- 41.Fischer S, Bessert-Nettelbeck M, Kotrschal A, Taborsky B. 2015. Rearing-group size determines social competence and brain structure in a cooperatively breeding cichlid. Am. Nat. 186, 123–140. ( 10.1086/681636) [DOI] [PubMed] [Google Scholar]
- 42.Gonda A, Herczeg G, Merilä J. 2009. Habitat-dependent and -independent plastic responses to social environment in the nine-spined stickleback (Pungitius pungitius) brain. Proc. R. Soc. B 276, 2085–2092. ( 10.1098/rspb.2009.0026) [DOI] [PMC free article] [PubMed] [Google Scholar]
- 43.Kotrschal A, Rogell B, Maklakov AA, Kolm N. 2012. Sex-specific plasticity in brain morphology depends on social environment of the guppy, Poecilia reticulata. Behav. Ecol. Sociobiol. 66, 1485–1492. ( 10.1007/s00265-012-1403-7) [DOI] [Google Scholar]
- 44.Robertson DR. 1972. Social control of sex reversal in a coral-reef fish. Science 177, 1007–1009. ( 10.1126/science.177.4053.1007) [DOI] [PubMed] [Google Scholar]
- 45.Nakashima Y, Sakai Y, Karino K, Kuwamura T. 2000. Female-female spawning and sex change in a haremic coral-reef fish, Labroides dimidiatus. Zoolog. Sci. 17, 967–970. ( 10.2108/zsj.17.967) [DOI] [Google Scholar]
- 46.Sakai Y, Kohda M. 2001. Spawning timing of the cleaner wrasse, Labroides dimidiatus, on a warm temperate rocky shore. Ichthyol. Res. 48, 23–30. ( 10.1007/s10228-001-8113-x) [DOI] [Google Scholar]
- 47.Wong MYL, Buston PM, Munday PL, Jones GP. 2007. The threat of punishment enforces peaceful cooperation and stabilizes queues in a coral-reef fish. Proc. R. Soc. B 274, 1093–1099. ( 10.1098/rspb.2006.0284) [DOI] [PMC free article] [PubMed] [Google Scholar]
- 48.Randall JE. 1958. A review of the labrid fish genus Labroides, with descriptions of two new species and notes on ecology. Pacific Science 12, 327–347. [Google Scholar]
- 49.Losey GS., Jr 1979. Fish cleaning symbiosis: proximate causes of host behaviour. Anim. Behav. 27, 669–685. ( 10.1016/0003-3472(79)90004-6) [DOI] [Google Scholar]
- 50.Grutter AS, Bshary R. 2003. Cleaner wrasse prefer client mucus: support for partner control mechanisms in cleaning interactions. Proc. R. Soc. Lond. B 270(Suppl. 2), S242–S244. ( 10.1098/rsbl.2003.0077) [DOI] [PMC free article] [PubMed] [Google Scholar]
- 51.Bshary R, Grutter AS. 2005. Punishment and partner switching cause cooperative behaviour in a cleaning mutualism. Biol. Lett. 1, 396–399. ( 10.1098/rsbl.2005.0344) [DOI] [PMC free article] [PubMed] [Google Scholar]
- 52.Bshary R, Grutter AS. 2006. Image scoring and cooperation in a cleaner fish mutualism. Nature 441, 975–978. ( 10.1038/nature04755) [DOI] [PubMed] [Google Scholar]
- 53.Bshary R. 2001. The cleaner fish market. In Economics in nature: social dilemmas, mate choice and biological markets (eds Noë R, Van Hooff JARAM, Hammerstein P), pp. 146–172. Cambridge, UK: Cambridge University Press. [Google Scholar]
- 54.Bshary R, Grutter AS, Willener AST, Leimar O. 2008. Pairs of cooperating cleaner fish provide better service quality than singletons. Nature 455, 964–966. ( 10.1038/nature07184) [DOI] [PubMed] [Google Scholar]
- 55.Gingins S, Bshary R. 2014. Pairs of cleaner fish prolong interaction duration with client reef fish by increasing service quality. Behav. Ecol. 26, 350–358. ( 10.1093/beheco/aru194) [DOI] [Google Scholar]
- 56.Triki Z, Wismer S, Levorato E, Bshary R. 2018. A decrease in the abundance and strategic sophistication of cleaner fish after environmental perturbations. Glob. Change Biol. 24, 481–489. ( 10.1111/gcb.13943) [DOI] [PubMed] [Google Scholar]
- 57.Wismer S, Pinto AI, Vail AL, Grutter AS, Bshary R. 2014. Variation in cleaner wrasse cooperation and cognition: influence of the developmental environment? Ethology 120, 519–531. ( 10.1111/eth.12223) [DOI] [Google Scholar]
- 58.Triki Z, Wismer S, Rey O, Ann Binning S, Levorato E, Bshary R. 2019. Biological market effects predict cleaner fish strategic sophistication. Behav. Ecol. ( 10.1093/beheco/arz111 [DOI] [Google Scholar]
- 59.Victor BC. 1986. Duration of the planktonic larval stage of one hundred species of Pacific and Atlantic wrasses (family Labridae). Mar. Biol. 90, 317–326. ( 10.1007/BF00428555) [DOI] [Google Scholar]
- 60.Brothers EB, Thresher RE.1985. Pelagic duration, dispersal and the distribution of Indo-Pacific coral-reef fishes. In The ecology of coral reefs. Symposia series for undersea research NOAA'S Undersea Research Program, Vol. 3, No. 1, p. 53.
- 61.Hedgecock D. 1986. Is gene flow from pelagic larval dispersal important in the adaptation and evolution of marine invertebrates? Bull. Mar. Sci. 39, 550–564. [Google Scholar]
- 62.Dunbar RIM. 1998. The social brain hypothesis. Evol. Anthropol. 6, 178–190. () [DOI] [Google Scholar]
- 63.Barton RA, Harvey PH. 2000. Mosaic evolution of brain structure in mammals. Nature 405, 1055–1058. ( 10.1038/35016580) [DOI] [PubMed] [Google Scholar]
- 64.Goodson JL. 2005. The vertebrate social behavior network: evolutionary themes and variations. Horm. Behav. 48, 11–22. ( 10.1016/j.yhbeh.2005.02.003) [DOI] [PMC free article] [PubMed] [Google Scholar]
- 65.O'Connell LA, Hofmann HA. 2011. The vertebrate mesolimbic reward system and social behavior network: a comparative synthesis. J. Comp. Neurol. 519, 3599–3639. ( 10.1002/cne.22735) [DOI] [PubMed] [Google Scholar]
- 66.Naumann RK, Ondracek JM, Reiter S, Shein-Idelson M, Tosches MA, Yamawaki TM, Laurent G. 2015. The reptilian brain. Curr. Biol. 25, R317–R321. ( 10.1016/j.cub.2015.02.049) [DOI] [PMC free article] [PubMed] [Google Scholar]
- 67.Portavella M. 2004. Avoidance response in goldfish: emotional and temporal involvement of medial and lateral telencephalic pallium. J. Neurosci. 24, 2335–2342. ( 10.1523/JNEUROSCI.4930-03.2004) [DOI] [PMC free article] [PubMed] [Google Scholar]
- 68.Salas C, Rodríguez F, Vargas JP, Durán E, Torres B. 1996. Spatial learning and memory deficits after telencephalic ablation in goldfish trained in place and turn maze procedures. Behav. Neurosci. 110, 965–980. ( 10.1037/0735-7044.110.5.965) [DOI] [PubMed] [Google Scholar]
- 69.López JC, Bingman VP, Rodríguez F, Gómez Y, Salas C. 2000. Dissociation of place and cue learning by telencephalic ablation in goldfish. Behav. Neurosci. 114, 687–699. ( 10.1037/0735-7044.114.4.687) [DOI] [PubMed] [Google Scholar]
- 70.O'Connell LA, Hofmann HA. 2012. Evolution of a vertebrate social decision-making network. Science 336, 1154–1157. ( 10.1126/science.1218889) [DOI] [PubMed] [Google Scholar]
- 71.Simões JM, Teles MC, Oliveira RF, Van der Linden A, Verhoye M. 2012. A three-dimensional stereotaxic MRI brain atlas of the cichlid fish Oreochromis mossambicus. PLoS ONE 7, e44086 ( 10.1371/journal.pone.0044086) [DOI] [PMC free article] [PubMed] [Google Scholar]
- 72.Gould SJ. 1975. Allometry in primates, with emphasis on scaling and the evolution of the brain. Contrib. Primatol. 5, 244–292. [PubMed] [Google Scholar]
- 73.Schmidt-Nielsen K. 1984. Scaling: why is animal size so important? Cambridge, UK: Cambridge University Press. [Google Scholar]
- 74.Smith RJ. 1984. Allometric scaling in comparative biology: problems of concept and method. Am. J. Physiol.-Regul. Integr. Comp. Physiol. 246, R152–R160. ( 10.1152/ajpregu.1984.246.2.R152) [DOI] [PubMed] [Google Scholar]
- 75.Martin RD, Harvey PH. 1985. Brain size allometry ontogeny and phylogeny. In Size and scaling in primate biology (ed. Jungers WL.), pp. 147–173. Boston, MA: Springer. [Google Scholar]
- 76.Byrne RW. 1996. Machiavellian intelligence. Evol. Anthropol. 5, 172–180. () [DOI] [Google Scholar]
- 77.Kolb EM, Rezende EL, Holness L, Radtke A, Lee SK, Obenaus A, Garland T. 2013. Mice selectively bred for high voluntary wheel running have larger midbrains: support for the mosaic model of brain evolution. J. Exp. Biol. 216, 515–523. ( 10.1242/jeb.076000) [DOI] [PubMed] [Google Scholar]
- 78.Deaner RO, Nunn CL, van Schaik CP.. 2000. Comparative tests of primate cognition: different scaling methods produce different results. Brain Behav. Evol. 55, 44–52. ( 10.1159/000006641) [DOI] [PubMed] [Google Scholar]
- 79.Mink JW, Blumenschine RJ, Adams DB. 1981. Ratio of central nervous system to body metabolism in vertebrates: its constancy and functional basis. Am. J. Physiol.-Regul. Integr. Comp. Physiol. 241, R203–R212. ( 10.1152/ajpregu.1981.241.3.R203) [DOI] [PubMed] [Google Scholar]
- 80.Navarrete A, van Schaik CP, Isler K.. 2011. Energetics and the evolution of human brain size. Nature 480, 91–93. ( 10.1038/nature10629) [DOI] [PubMed] [Google Scholar]
- 81.Burish MJ, Kueh HY, Wang SS-H. 2004. Brain architecture and social complexity in modern and ancient birds. Brain Behav. Evol. 63, 107–124. ( 10.1159/000075674) [DOI] [PubMed] [Google Scholar]
- 82.Demski LS, Knigge KM. 1971. The telencephalon and hypothalamus of the bluegill (Lepomis macrochirus): evoked feeding, aggressive and reproductive behavior with representative frontal sections. J. Comp. Neurol. 143, 1–16. ( 10.1002/cne.901430102) [DOI] [PubMed] [Google Scholar]
- 83.Godwin J, Thompson R. 2012. Nonapeptides and social behavior in fishes. Horm. Behav. 61, 230–238. ( 10.1016/j.yhbeh.2011.12.016) [DOI] [PubMed] [Google Scholar]
- 84.Bernier NJ, Peter RE. 2001. The hypothalamic–pituitary–interrenal axis and the control of food intake in teleost fish. Comp. Biochem. Physiol. B Biochem. Mol. Biol. 129, 639–644. ( 10.1016/S1096-4959(01)00360-8) [DOI] [PubMed] [Google Scholar]
- 85.Kuwamura T. 1984. Social structure of the protogynous fish Labroides dimidiatus. Publ. Seto Mar. Biol. Lab. 29, 117–177. ( 10.5134/176083) [DOI] [Google Scholar]
- 86.Triki Z, Bshary R. 2019. Fluctuations in coral reef fish densities after environmental disturbances on the northern Great Barrier Reef. PeerJ 7, e6720 ( 10.7717/peerj.6720) [DOI] [PMC free article] [PubMed] [Google Scholar]
- 87.Barton RA, Dunbar RI. 1997. Evolution of the social brain. Machiavellian Intell. II Ext. Eval. 2, 240 ( 10.1017/CBO9780511525636.010) [DOI] [Google Scholar]
- 88.Pérez-Barbería FJ, Shultz S, Dunbar RIM. 2007. Evidence for coevolution of sociality and relative brain size in three orders of mammals. Evolution 61, 2811–2821. ( 10.1111/j.1558-5646.2007.00229.x) [DOI] [PubMed] [Google Scholar]
- 89.Gonzalez-Voyer A, Winberg S, Kolm N. 2009. Social fishes and single mothers: brain evolution in African cichlids. Proc. R. Soc. B 276, 161–167. ( 10.1098/rspb.2008.0979) [DOI] [PMC free article] [PubMed] [Google Scholar]
- 90.Burkart JM, Schubiger MN, van Schaik CP. 2017. The evolution of general intelligence. Behav. Brain Sci. 40, e2019 ( 10.1017/S0140525X16000959) [DOI] [PubMed] [Google Scholar]
- 91.van Praag H, Kempermann G, Gage FH.. 2000. Neural consequences of enviromental enrichment. Nat. Rev. Neurosci. 1, 191–198. ( 10.1038/35044558) [DOI] [PubMed] [Google Scholar]
Associated Data
This section collects any data citations, data availability statements, or supplementary materials included in this article.
Supplementary Materials
Data Availability Statement
Data used in the study and the script for statistical analyses and generating figures are available as part of the electronic supplementary material.