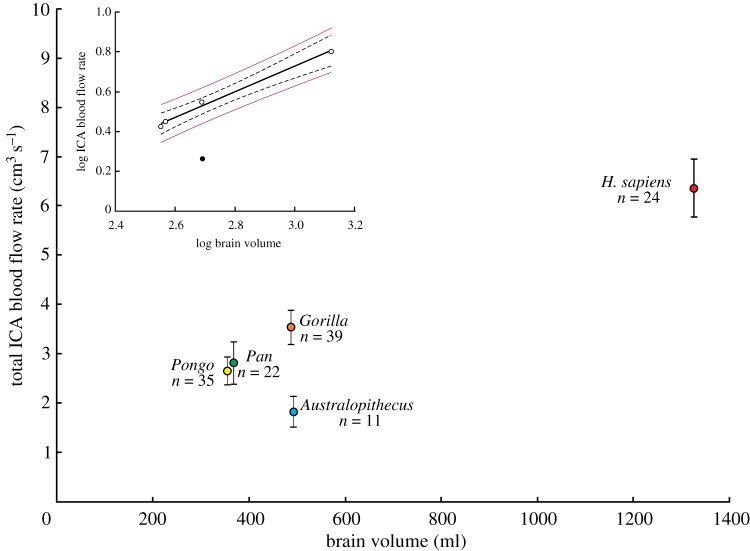
Figure 1.
Total blood flow rate of both ICAs calculated from ICA foramen radius data with the new, ‘empirical equation’ and a wall thickness-to-lumen radius ratio of w = 0.30, in relation to brain volume (Vbr) in selected hominids. Means, 95% CI and sample sizes are shown. Inset is the regression of log10 against log10 Vbr for four genera of hominids, namely Pongo, Pan, Gorilla and archaic H. sapiens (unfilled circles), showing that Australopithecus (filled circle) falls well below the regression mean's 95% confidence bands (dashed lines) and 95% prediction limits (thin red lines). See electronic supplementary material, table S2 for statistics of individual species. (Online version in colour.)

