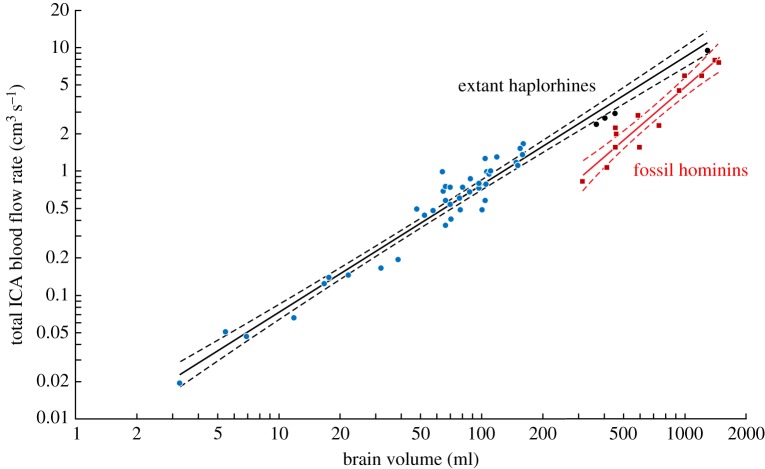
Figure 2.
Total blood flow rate of both ICAs in relation to brain volume (Vbr). is calculated from ICA foramen radius data with a wall thickness-to-lumen radius ratio (w) of 0.30 and the new empirical equation. The regression equation for 44 species of extant haplorhine primates (blue and black circles) is Vbr 1.03±0.07 CI (R2 = 0.95), and that for 12 species of fossil hominins (red squares) is Vbr1.41±0.30 CI (R2 = 0.91). Solid lines are the regression means; dashed lines are 95% confidence bands. Black circles are Pongo, Pan, Gorilla and H. sapiens. See electronic supplementary material, table S3 for data derived from [6,13,15]. (Online version in colour.)

