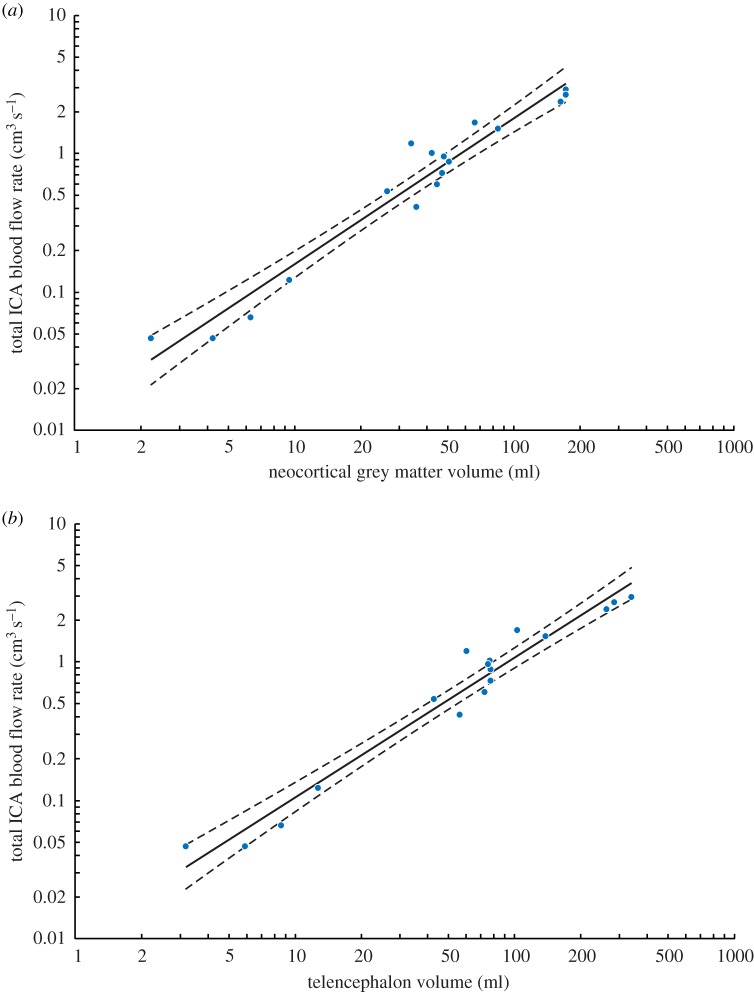
Figure 3.
Total blood flow rate of both ICAs in relation to (a) neocortical grey matter volume (Vgrey) and (b) telencephalon volume (Vtele) in 17 species of extant haplorhine primates. values calculated with the new empirical equation and w = 0.30 from ICA foramen radii in [6,13]. Volume data are from [17], which include data from [18,19]; duplicate or triplicate data were averaged to obtain one point for each species. The equations are, Vgrey1.06±0.14 CI (R2 = 0.95) and Vtele1.01±0.12 CI (R2 = 0.96). Solid line is the regression mean; dashed lines represent the 95% confidence bands. See electronic supplementary material, table S4 for individual data. (Online version in colour.)

