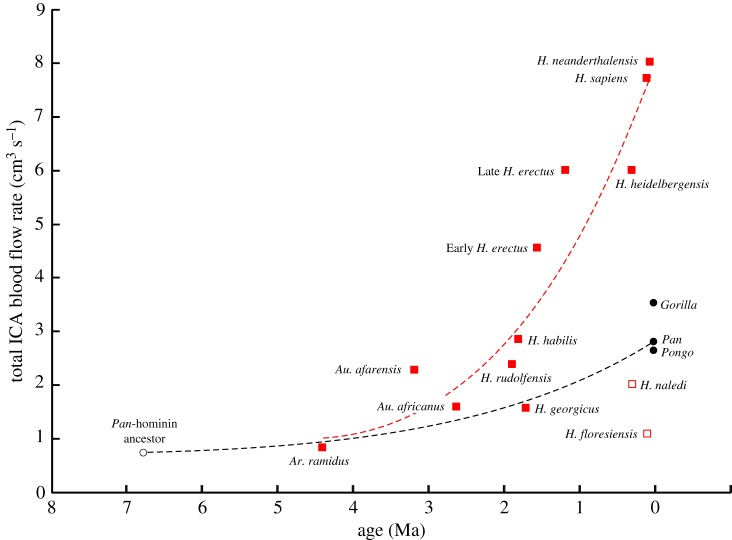
Figure 4.
Total blood flow rate of both ICAs in relation to age of hominins (red squares) and recent great apes (black circles). Two unusual hominin species (open squares) are Homo naledi and Homo floresiensis, which are excluded from the third-order polynomial curve used to visualize hominin evolution. A hypothetical common ancestor of Pan–Homo sapiens lineages is proposed at 6.75 Ma [39,45,46] with similar to that of A. ramidus. The evolutionary trajectories from this ancestor are both upward, but of different magnitudes. (Online version in colour.)

