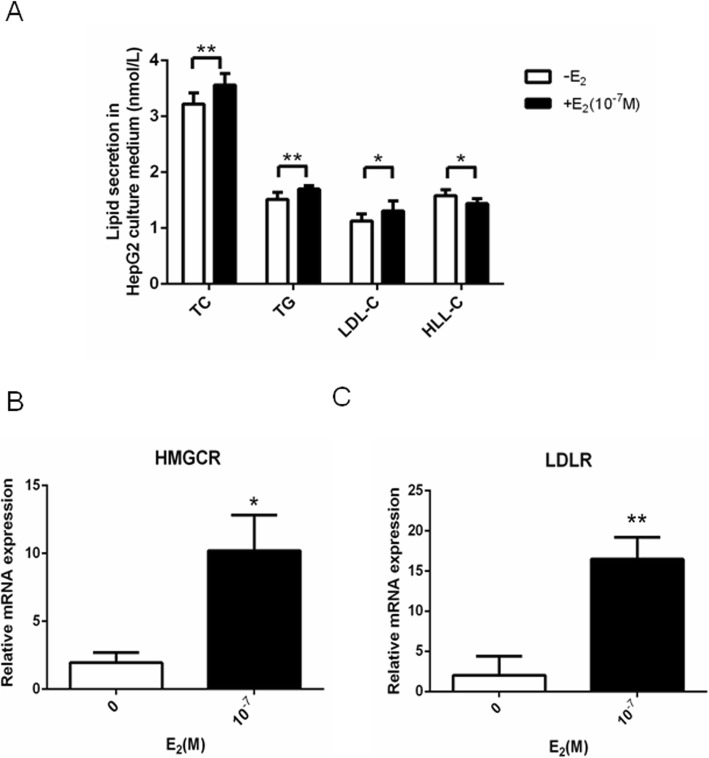
Fig. 2.
E2 increased lipid secretion and the expression of HMGCR and LDLR mRNA in HepG2 cells. a The concentration of TC, TG, LDL-C and HDL-C in HepG2 cells after 24 h treatment with E2 (10− 7 mol/l). b and c The HMGCR (b) and LDLR (c) mRNA expression in HepG2 cells after 24 h treatment with E2 (10− 7 mol/l). The experiments were repeated three times and data are presented as means ± SEM. *p < 0.05 and **p < 0.01 compared with the corresponding control group. E2: estradiol; TC: total cholesterol; TG: triglycerides; LDL-C: low-density lipoprotein cholesterol; HDL-C: high-density lipoprotein cholesterol; LDLR: low-density lipoprotein receptor; HMGCR: 3-hydroxy-3-methylglutaryl-CoA reductase

