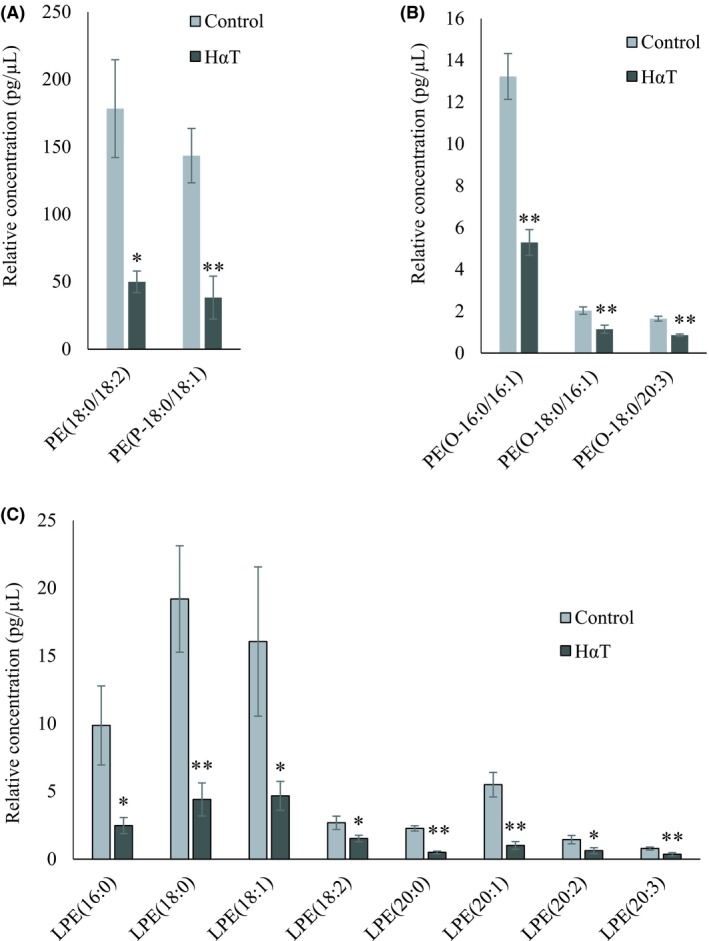
Figure 6.

Relative quantity of phosphatidylethanolamines in freshly isolated urinary exosomes from HαT patients and healthy volunteers. Panel A, B and C represent significantly changed phosphatidylethanolamine (PE) and PE‐P, PE‐O and lysophosphatidylethanolamine (LPE), respectively. Data are mean ± SE of relative quantity (pg/µL). * and ** indicate significance at P < .05 and < .01, respectively
