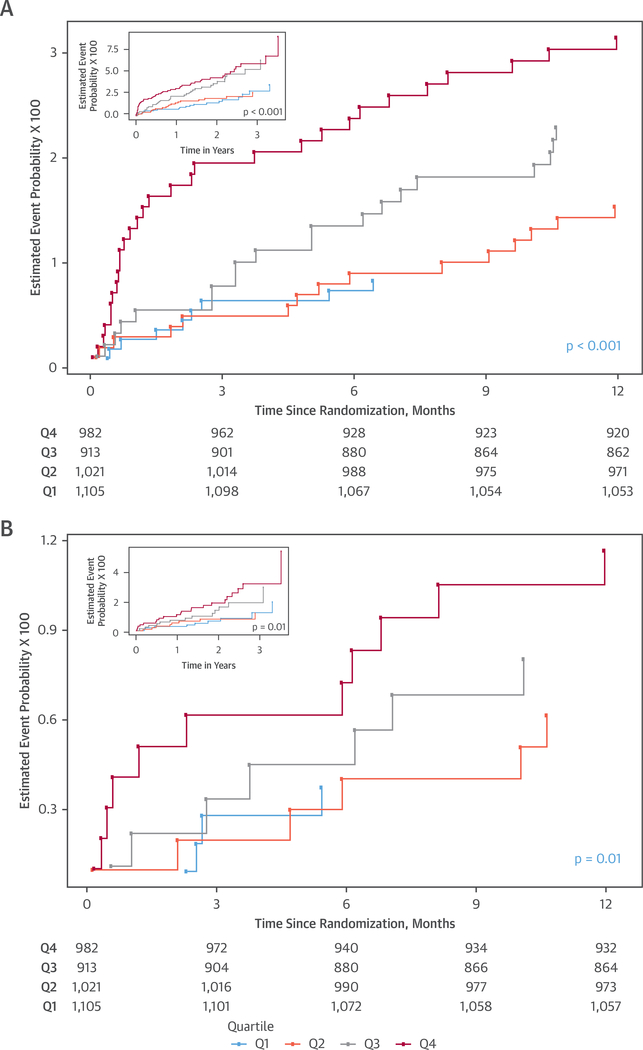
FIGURE 2. Cumulative Hazard Curves Depicting Time-to-Events as a Function of hsTnI Quartiles at Presentation.
(A) Death, acute myocardial infarction, or hospitalization for unstable angina at 1 year. (B) Cardiovascular death or acute myocardial infarction at 1 year. The insets detail outcomes to 3 years of follow-up. Outcomes are depicted to 12 months; insets demonstrate outcomes through complete follow-up of the PROMISE trial. Q = quartile; other abbreviations as in Figure 1.

