Fig. 4.
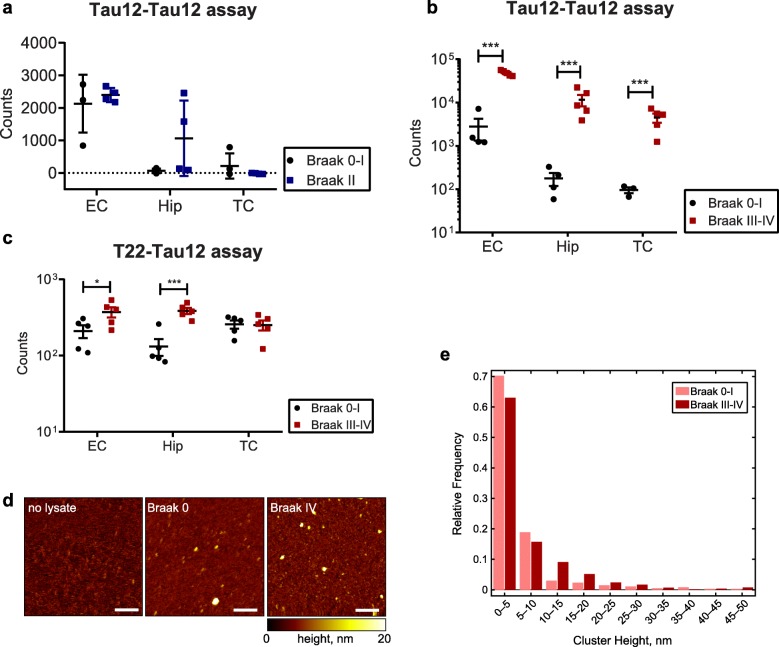
ELISA assays and atomic force microscopy (AFM) reveal more abundant tau oligomers in Braak III–IV ECs. Comparison of ELISA counts from Braak 0–I controls with a) Braak II entorhinal cortices (EC), hippocampi (Hip), and temporal cortices (TC) and b, c) Braak III–IV EC, Hip and TC, using Tau12-Tau12 (a, b) or T22-Tau12 (c) assays. d) Representative AFM images of eluates after Tau12 immunoprecipitation; left: eluate without brain lysate (negative control), middle: eluate of Braak 0 EC, right: eluate of Braak IV EC. Scale bars represent 200 nm. e) Relative frequencies of cluster heights detected from AFM scans of two Braak 0 and two Braak IV EC tissue samples shows increase of clusters > 10 nm in Braak IV samples. Number of clusters detected: Braak 0–I: 1343, Braak III–IV: 1053. Student’s t-tests: *, p < 0.05, ***, p < 0.001

