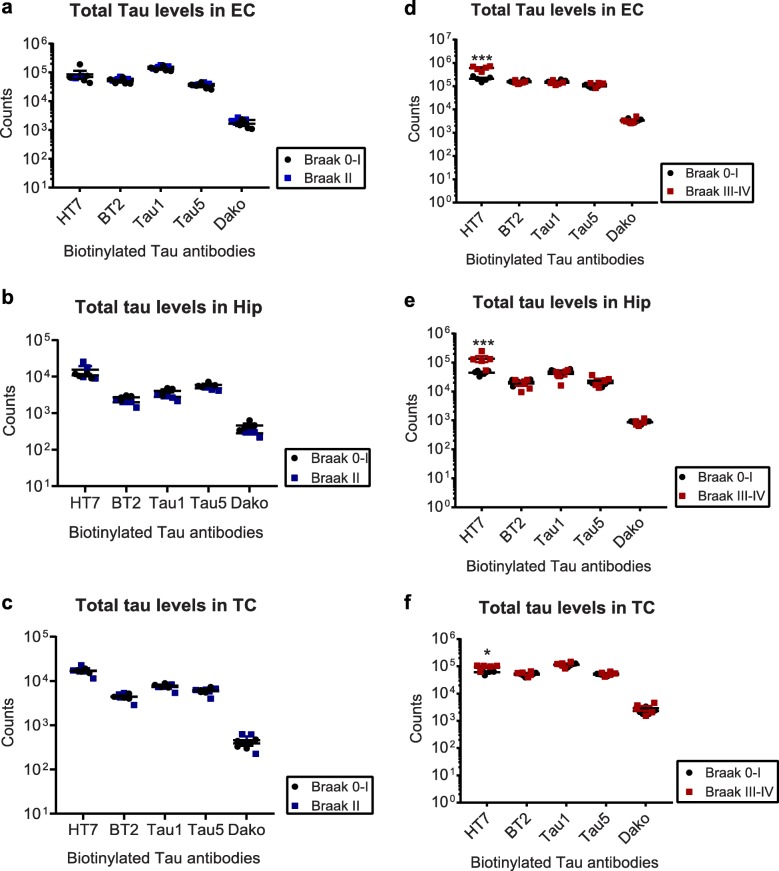
Fig. 5.
Total tau levels at different Braak stages in different brain regions. Total tau levels in a, d) Entorhinal cortices (EC), b, e) Hippocampi (Hip), and c, f) Temporal Cortices (TC) from Braak II (a–c) and Braak III–IV (d–f) samples, along with their age-matched Braak 0–I controls. Student’s t-tests: *, p < 0.05, ***, p < 0.001

