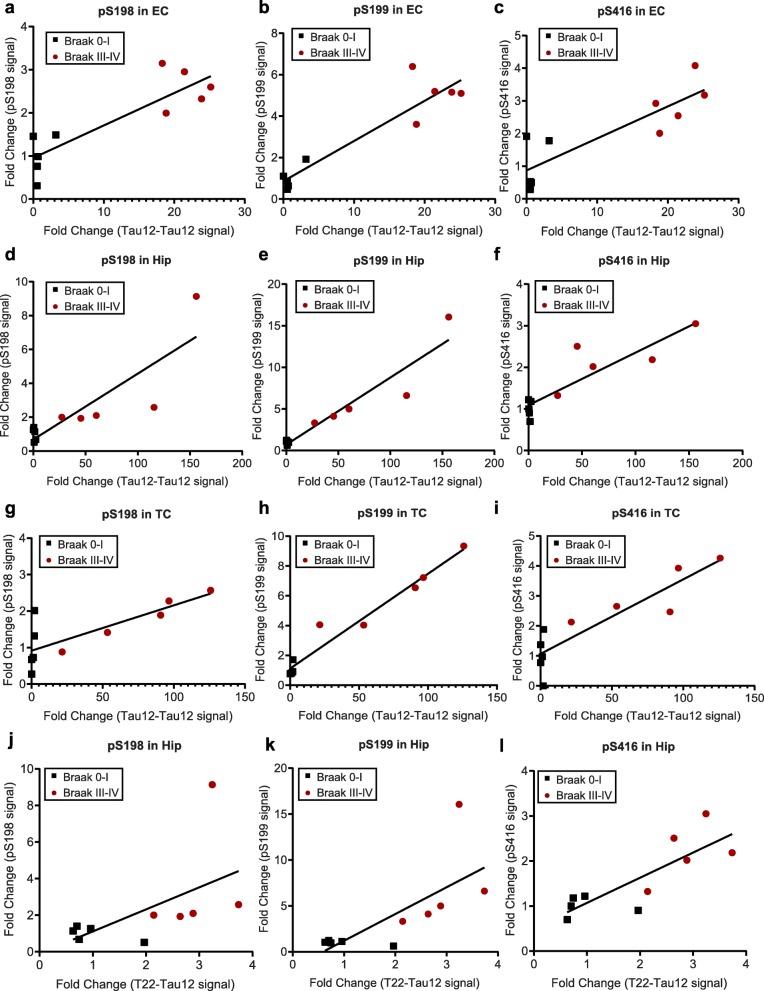
Fig. 9.
Correlation of tau oligomerization with pS198, pS199, and pS416 fold changes in all brain regions. Spearman correlation of the fold changes in Tau12-Tau12 signal with the fold changes (black squares: Braak 0–I / average (Braak 0–I); red circles: Braak III–IV / average (Braak 0–I)) of a) pS198, b) pS199 and c) pS416 in entorhinal cortex (EC), d) pS198, e) pS199 and f) pS416 in hippocampus (Hip), g) pS198, h) pS199 and i) pS416 in temporal cortex (TC) and Spearman correlation of the fold changes in T22-Tau12 signal with the fold changes (black squares: Braak 0–I / average (Braak 0–I), red circles: Braak III–IV / average (Braak 0–I)) of j) pS198, k) pS199 and l) pS416 in hippocampus (Hip). Results of the statistical analysis are summarized in Table 4

