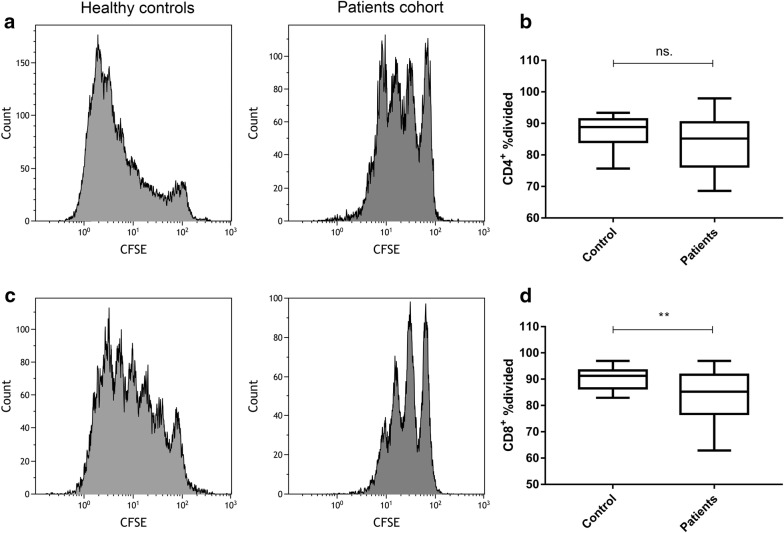
Fig. 3.
The proliferation potential of different subsets of peripheral T cells. a, b The %divided of CD8+ T cells of SCLC patients was lower compared with healthy controls, 85.3 [62.9–96.3] vs. 91.3 [82.9–96.9], p = 0.0058; c, d the mean %divided of CD4+ T cells of SCLC patients was lower than that of healthy controls, but no statistic difference was observed, 85.2 [68.6–97.9] vs. 88.8 [75.6–93.4], p = 0.1611. Differences between two groups were determined by Mann–Whitney test (Additional file 1: Table S1)

