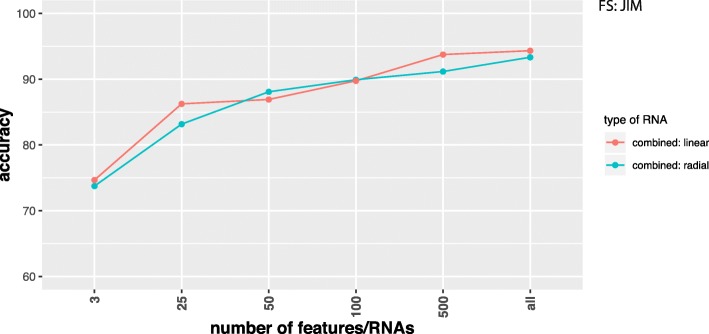
Fig. 5.
Comparison of classification results for SVMs with a linear (red) and radial (green) basis kernel in dependence on the number of input features/RNAs (x-axis). Data combine coding and non-coding RNAs and the label ’all’ corresponds to 15484 RNAs. Feature selection method used is JIM. Data were RPKM normalized

