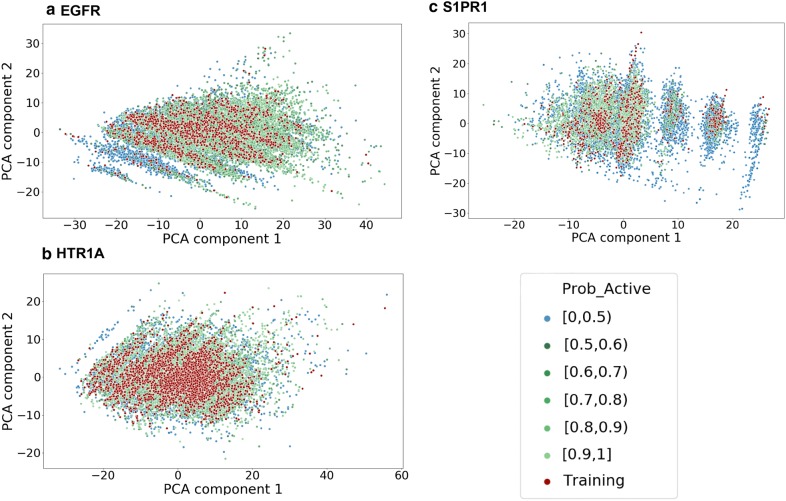
Fig. 5.
PCA analysis for a EGFR (explained variance 82.8%), b HTR1A (explained variance 75.0%) and c S1PR1 (explained variance 79.3%) dataset. The red dots are the training set, the blue dots are the predicted inactive compounds in the sampled set and other dots are the predicted actives in the sampled set with different level of probability of being active

