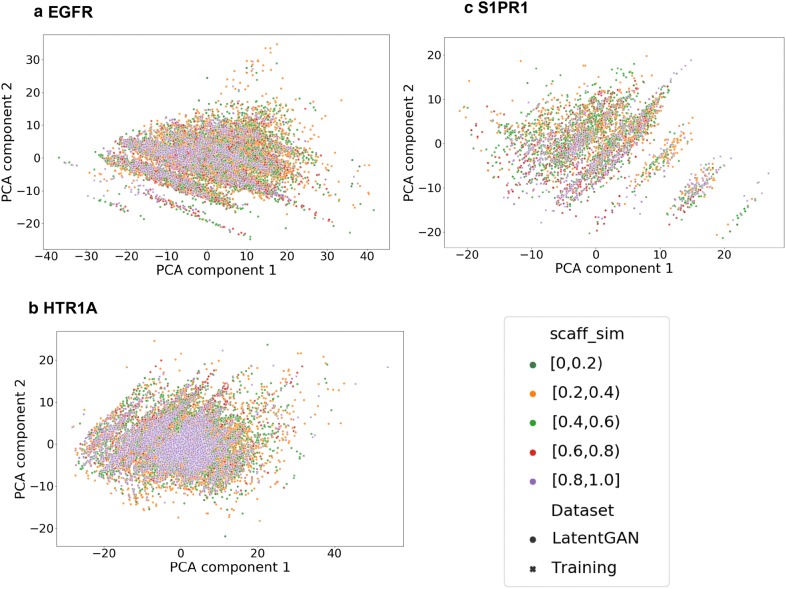
Fig. 6.
The same PCA analysis, showing the Murcko scaffold similarities of the predicted active compounds for a EGFR (explained variance 80.2%), b HTR1A (explained variance 74.1%) and c S1PR1 (explained variance 71.3%). Note that due to the lower amount in the outlier region of c, the image has been rotated slightly. No significant relationship between the scaffold similarities and the regions was found. For a separation of the generated points by similarity interval, see Additional file 1

