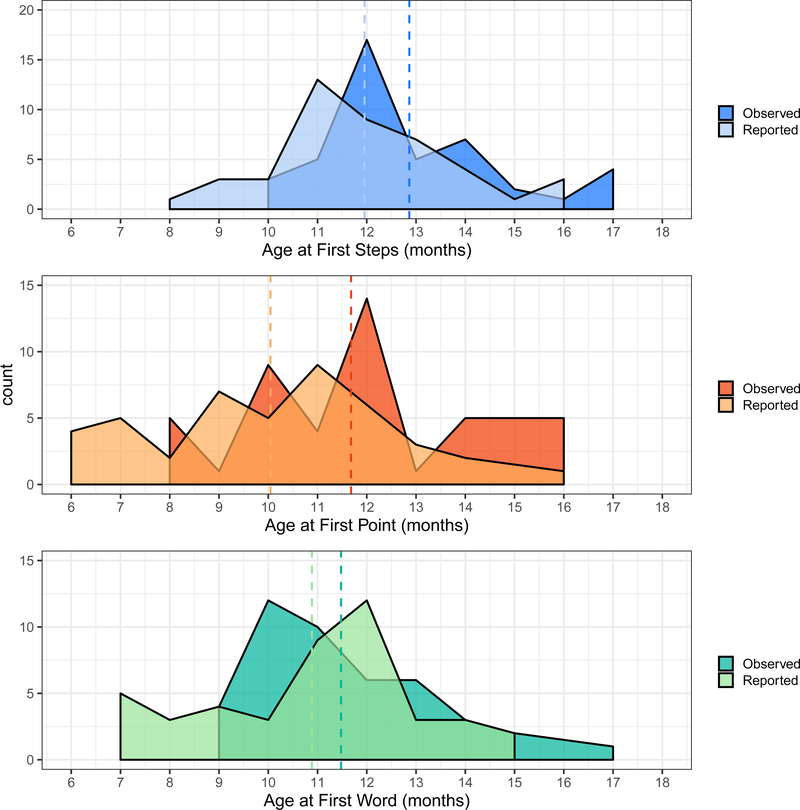
Figure 1.
Density plot of observed vs. reported age in months at first instance of walking, pointing, and talking (top to bottom). Dashed vertical lines represent mean for observed and reported data. Difference in distribution means is significant for pointing and walking, but not talking; see text for details.

