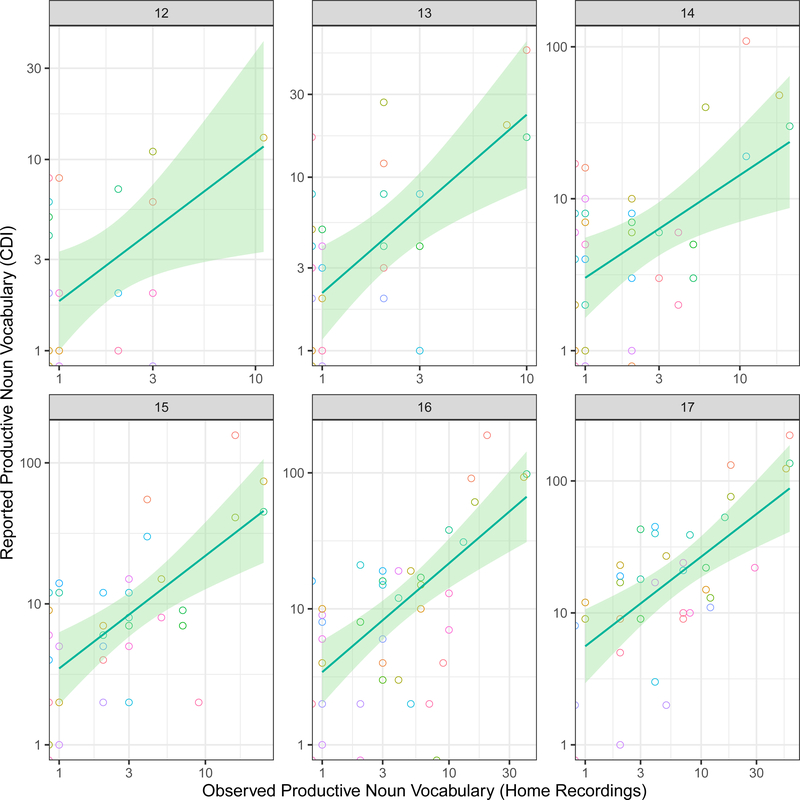
Figure 3.
Observed vs. reported noun vocabulary by month. Panels show separate months; each point in a panel represents one infant, the dot color corresponds to the same infant in each panel. Correlations in month 13–17 are significant; see text for details. Axes are loglog scaled; half circles at the edge indicate vocabularies of 0. Ribbon represents 95 percent confidence interval.

