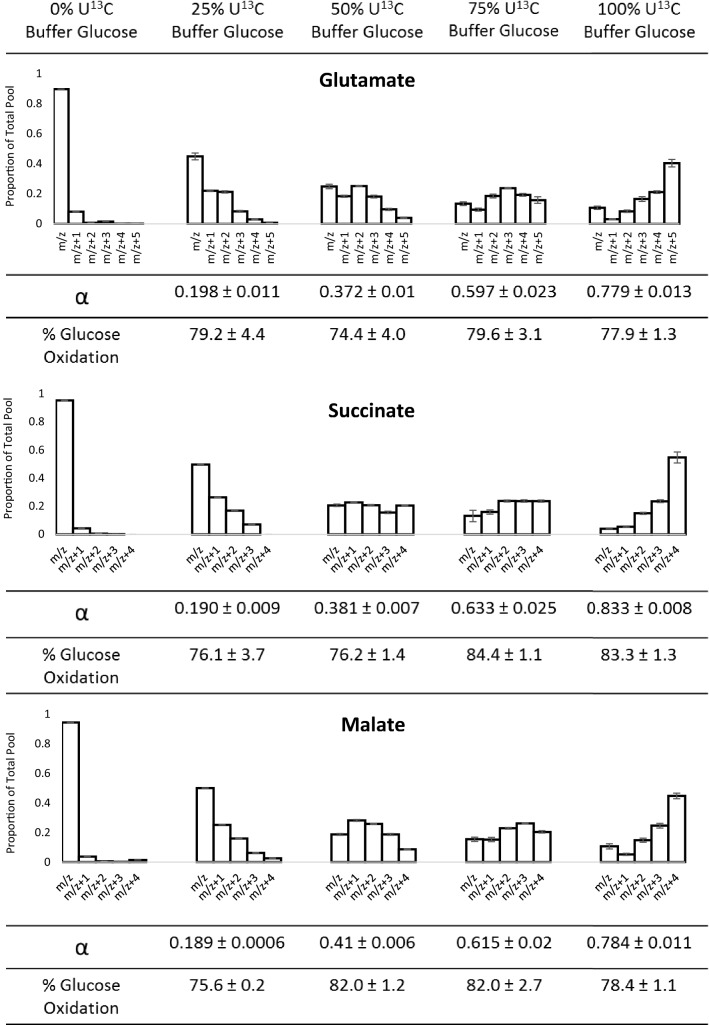
Fig. 3.
Isotope distribution plots showing the labelling distribution of glutamate, succinate and malate when the percentage of glucose in the perfusion buffer which was U-13C labelled was 0%, 25%, 50%, 75% or 100% (each n = 3). Values displayed as mean ± SEM. Note that owing to the small value of the SEM relative to the mean, the SEM is highlighted in grey on some bars

