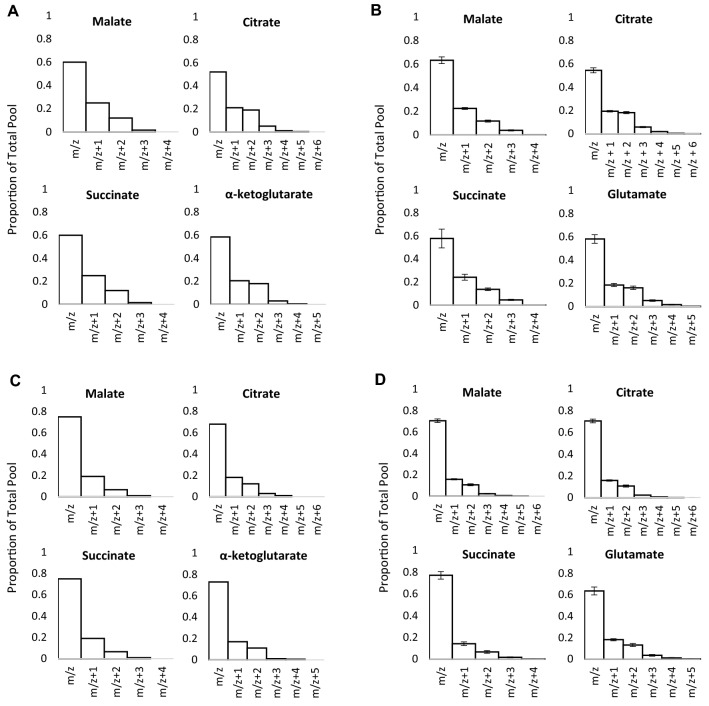
Fig. 4.
a Isotopologue distributions predicted by the model at α = 0.145 for malate, citrate, α-ketoglutarate and succinate. b Isotopologue distributions for malate, citrate, glutamate and succinate measured in heart tissue perfused for 32 min with 25% U13C labelled glucose by LC–MS (n = 7, displayed as mean ± SEM). c Isotopologue distributions predicted by the model at α = 0.089 for malate, citrate, α-ketoglutarate and succinate. d Isotopologue distributions for malate, citrate, glutamate and succinate measured in heart tissue perfused for 32 min with 25% U13C labelled triglycerides by LC–MS (n = 7, displayed as mean ± SEM). All hearts were perfused with a total of 11 mM glucose and 0.4 mM equivalent triglyceride

