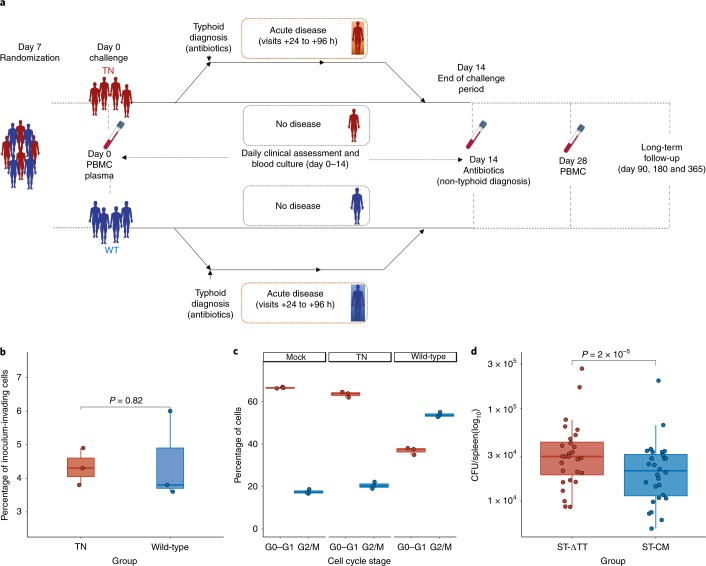
Fig. 1. Trial design.
a, Schematic of trial design (Supplementary Information); comparison of wild-type and TN strains. b, Cellular invasion assessed using a gentamicin protection assay. MOI = 50, n = 3 independent replicates, two-sided Mann–Whitney U-test. c, Induction of cell cycle arrest in Henle-407 cells infected with the wild-type or TN strain (MOI = 50). Intoxicated cells show a larger proportion of cells in the G2/M phase of the cell cycle. n = 3 independent replicates. d, Comparison of the bacterial loads of S. Typhi Quailes typhoid toxin-null mutant (ST-ΔTT, ∆pltB, ∆pltA, ∆cdtB) with S. Typhi Quailes typhoid toxin catalytic mutant (ST-CM, cdtBH160Q, pltBS35A, pltAE133A). n = 28, Wilcoxon signed-rank test. The box plots display the median and IQR, with the upper whiskers extending to the largest value ≤1.5 × IQR from 75th percentile and the lower whiskers extending to smallest values ≤1.5 × IQR from 25th percentile. The Fig. 1a images were sourced from Servier Medical Art and reproduced and adapted under a Creative Commons 3.0 unported license29.

