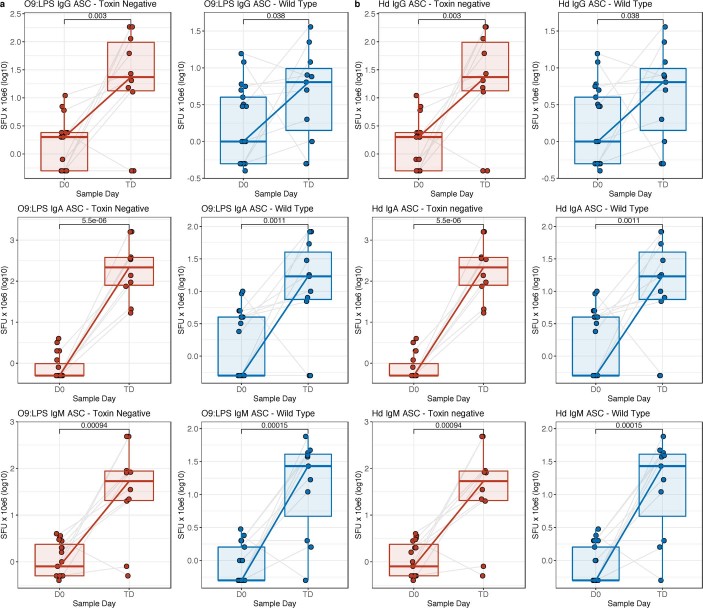
Extended Data Fig. 6. 09:LPS- and Hd-specific IgG, IgA and IgM ex vivo ASC responses.
a, 09:LPS. b, Hd. Participants diagnosed with typhoid, illustrated as log10 SFUs per 106 PBMCs. D0, baseline; TD, time of diagnosis (samples processed 24–48 h after initiation of treatment). Two-sided matched-pairs Wilcoxon signed-rank test. nWild-type = 11, nTN = 10. The box plots display the median and IQR, with the upper whiskers extending to the largest value ≤1.5 × IQR from the 75th percentile and the lower whiskers extending to the smallest values ≤1.5 × IQR from the 25th percentile.

