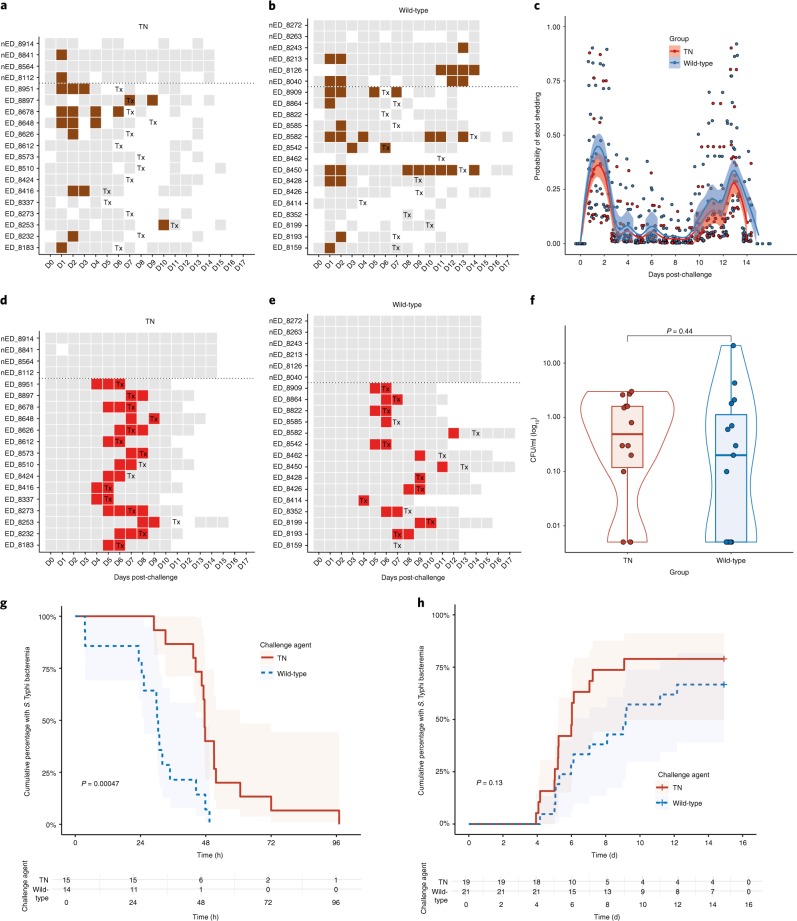
Fig. 3. Microbiological response to challenge with wild-type and TN S. Typhi.
a,b, Pattern of stool shedding after TN (a) and wild-type (b) challenge. The rows correspond to individual participants. Gray squares, negative sample; brown squares, positive stool culture; white squares = no sample collected. Tx is the day of treatment initiation. c, Probability of stool shedding S. Typhi over time after challenge. Samples were classified as culture-positive or culture-negative for S. Typhi and combined in mixed effects logistic regression models, as described previously18. nWild-type = 21, nTN = 19. d,e, Pattern of bacteremia after TN (d) and wild-type (e) challenge. Red squares = positive blood culture. Participants above the dotted lines did not meet the composite criteria for typhoid diagnosis. f, Quantitative blood culture at time of typhoid diagnosis. Samples with no colonies were assigned an arbitrary value corresponding to half the lower limit of detection (0.05 CFU ml−1). nWild-type = 15, nTN = 15, two-sided Mann–Whitney U-test. g,h, Kaplan–Meier survival curve showing the cumulative proportion of participants with bacteremia after challenge (g) and time to S. Typhi bacteremia (h). Participants not meeting the diagnostic criteria were censored at day 14. Cumulative proportion of participants with ongoing bacteremia were measured from time of treatment initiation to first persistently negative blood culture, according to challenge group. log-rank test. The box plots display the median and IQR, the upper whiskers extending to the largest value ≤1.5 × IQR from the 75th percentile and the lower whiskers extending to the smallest values ≤1.5 × IQR from the 25th percentile. The overlaid violin plots illustrate the distribution of the data points and their probability density31.

