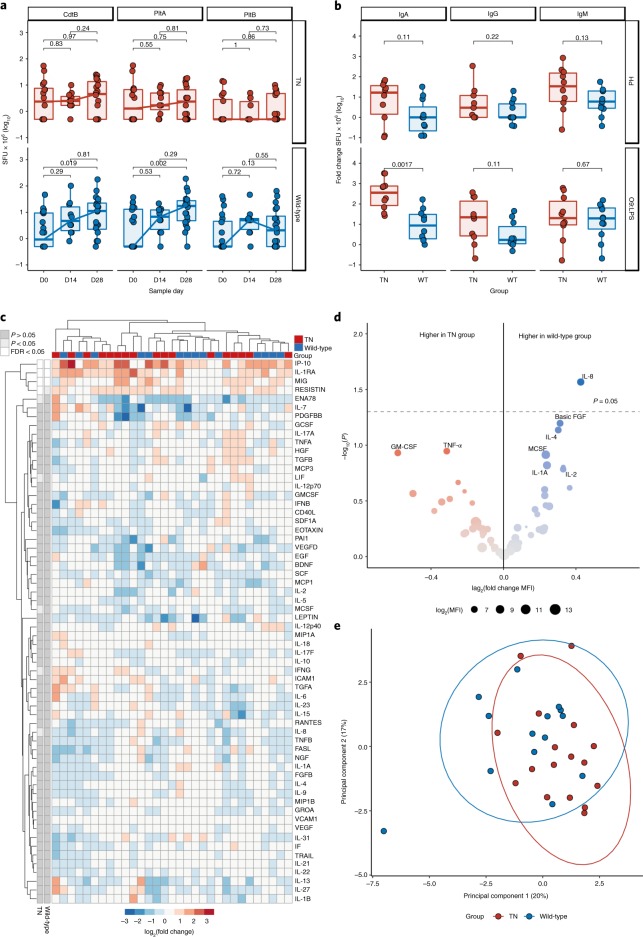
Fig. 4. Host response to challenge with wild-type and TN S. Typhi.
a, CdtB-, PltA- and PltB-specific IFN-γ-producing PBMCs at baseline, day 14 and 28 after challenge. nWild-type = 21, nTN = 19, Wilcoxon signed-rank test for within-group comparisons on paired samples. b, Magnitude of ASC response at typhoid diagnosis. nWild-type = 11, nTN = 10; two-sided Mann–Whitney U-test. The box plots display the median and IQR. c, Plasma cytokine profiles after challenge with wild-type and TN S. Typhi. Heatmap showing log2 fold change in MFI for each cytokine (rows) and participant (columns) at time of diagnosis relative to baseline. nWild-type = 15, nTN = 15. Rows are annotated by significance of cytokine up- or downregulation relative to baseline in each challenge group (white, significant after adjustment for multiple testing; light gray, significant before adjustment; dark gray, non-significant). Two-sided moderated t-test with Benjamin–Hochberg correction. Clustering by Euclidean distance. FDR, false discovery rate. d, Volcano plots illustrate plasma cytokine up/downregulation at typhoid diagnosis in wild-type and TN challenge groups, with adjustment for baseline. The size of each point reflects average abundance (log2MFI) in the plasma. nWild-type = 15, blue; nTN = 15, red. e, Principal component plot of log2 fold change in MFI relative to baseline for each participant. Ellipses are drawn with a 95% confidence level. nWild-type = 15, nTN = 15. FGFB, basic fibroblast growth factor; GM-CSF, granulocyte-macrophage colony-stimulating factor; M-CSF, macrophage colony-stimulating factor.

