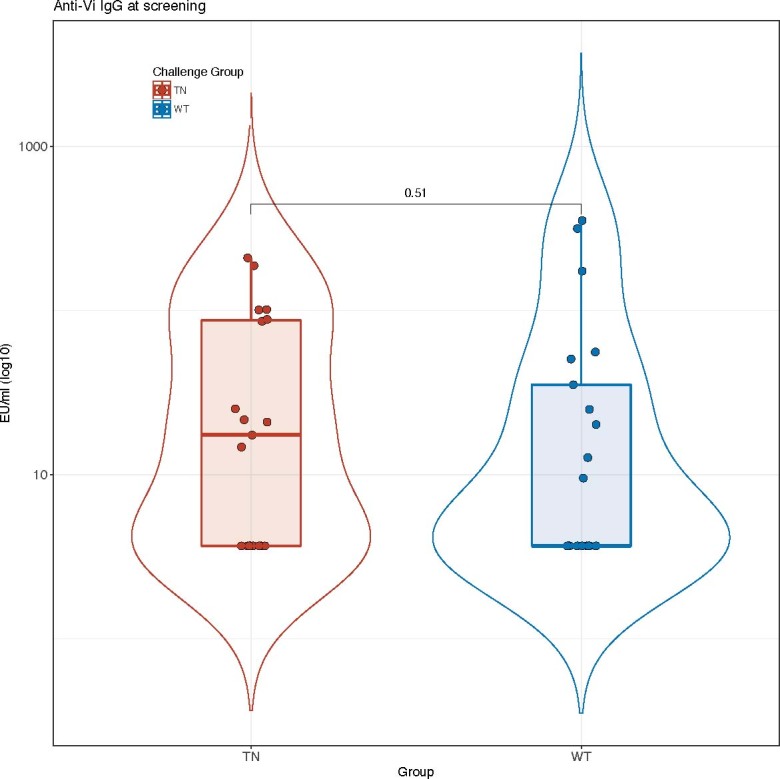
Extended Data Fig. 2. Baseline anti-Vi IgG.

S. Typhi Quailes strain (n = 21). Two-sided Mann–Whitney U-test. The box plots represent the median and IQR. The overlaid violin plots illustrate the distribution of the data points and their probability density. Samples below the lower limit of detection of the ELISA (7.4 EU ml−1) were assigned a value equating to half the lower limit of detection (3.7 EU ml−1)14. The box plots display the median and IQR, with the upper whiskers extending to the largest value ≤1.5 × IQR from the 75th percentile and the lower whiskers extending to the smallest values ≤1.5 × IQR from the 25th percentile. The overlaid violin plots illustrate the distribution of the data points and their probability density31. TN S. Typhi (n = 19).
