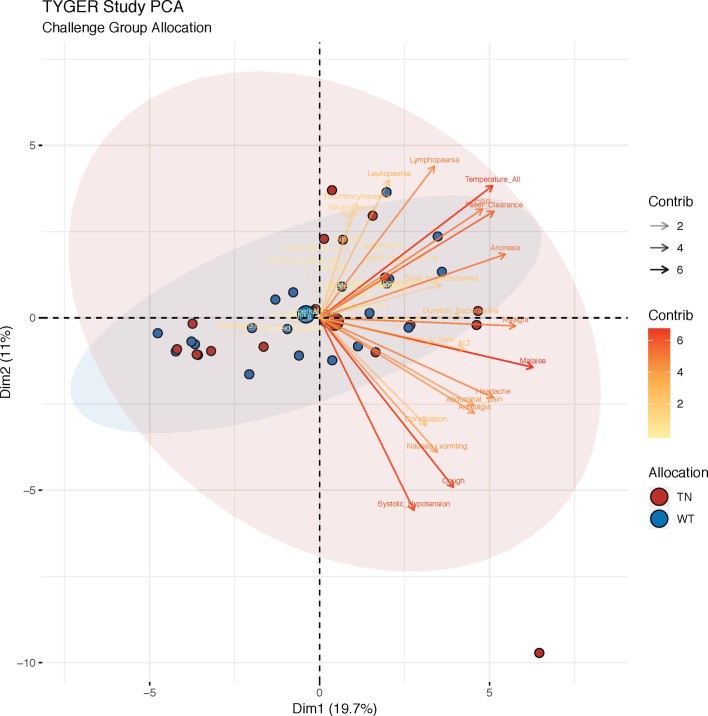
Extended Data Fig. 5. PCA biplot of disease severity by challenge agent.
PCA biplot of participants challenged with typhoid fever following challenge with TN (n = 19) or wild-type (n = 21) S. Typhi based on all clinical, microbiological and laboratory measures. The data points are colored by challenge agent allocation. The ellipses represent the 95% confidence levels for challenge agent. The biplot arrows represent the contributions of individual variables to a given principal component, scaled according to their relative contribution36.

