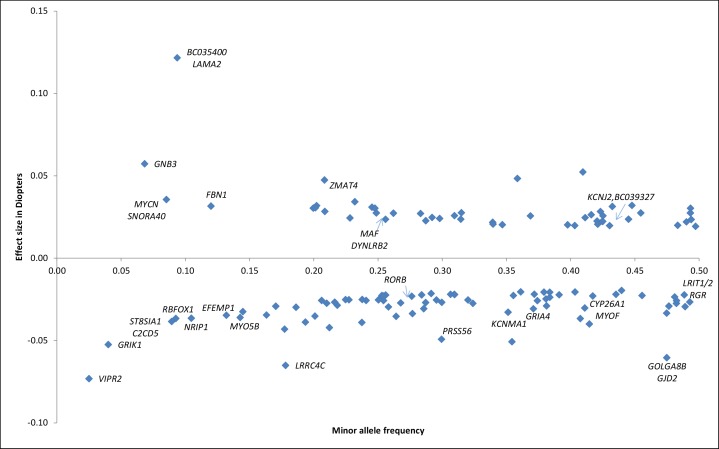
Figure 2.
Effect sizes of common and rare variants for myopia and refractive error. Overview of SNPs and annotated genes found in the most recent GWAS meta-analysis.24 The x-axis displays the minor allele frequency of each SNP; y-axis displays the effect size of the individual SNP in diopters; We transformed the z-scores of the fixed effect meta-analysis between CREAM (refractive error) and 23andMe (age of diagnosis of myopia) into effect sizes in diopters with the following formula24:  .
.

