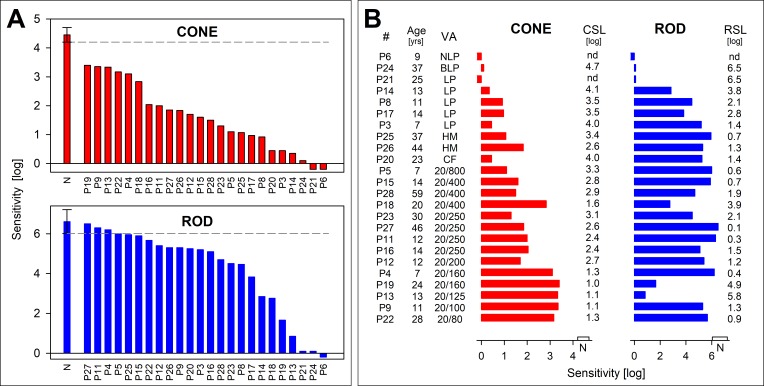
Figure 8.
Rod and cone photoreceptor-mediated function in GUCY2D-LCA. Full-field sensitivities for light-adapted red (red bars) and dark-adapted blue flashes (blue bars) to assess cone and rod function, respectively. (A) Sensitivities are ranked from high to low to illustrate the range of dysfunction in GUCY2D-LCA patients. All cone sensitivities are abnormal by 1 log unit or more, and the range includes very severe dysfunction. Rod sensitivities could reach normal levels in some patients, and there can be relatively good rod function in the majority of patients. Note that patient order (horizontal axis in each graph) is not the same for both rod and cone sensitivity levels, indicating that patients with better cone function are not necessarily the same as those with better rod function. (B) Cone and rod function ranked by visual acuity (lowest to highest, top to bottom). There is a strong relationship between acuity and the cone metrics, but rod and cone sensitivity are not closely related, as mentioned in (A). NLP, no light perception; BLP, bare light perception; LP, light perception; HM, hand motions; CF, count fingers; nd, not detected. Negative-going bars indicate no perception of the stimuli. Rod sensitivity for patient 21 and patient 24 and cone sensitivity for patient 24 were very close to instrument limit; these bars were set to 0.1 for this depiction. Brackets on (A) and bars on the horizontal axes on (B) are centered on the normal (N) mean sensitivity and the limits represent ±2 SD. Figure courtesy of Alejandro J. Roman (Scheie Eye Institute, University of Pennsylvania).

