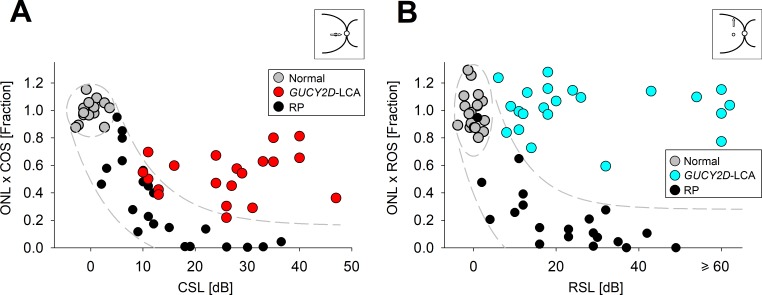
Figure 10.
Relation of retinal structure and visual function in GUCY2D-LCA. (A) Relationship between product of foveal ONL and COS thickness (as a fraction of normal mean) and visual function (cone sensitivity loss, CSL) in GUCY2D-LCA patients (red), normal control subjects (gray), and patients with forms of autosomal recessive retinitis pigmentosa, RP (black). CSL is estimated from FST in GUCY2D-LCA and foveal cone perimetry in other patients and normal subjects. (B) Relationship between product of rod hotspot ONL and ROS thickness (as a fraction of normal mean) and visual function (rod sensitivity loss, RSL) in GUCY2D-LCA patients (blue), normal control subjects (gray), and patients with various forms of RP (black). RSL is estimated from FST in GUCY2D-LCA and from dark-adapted perimetry in other patients and normal subjects. The ellipses in (A, B) enclose the 95% confidence interval of bivariate Gaussian distributions, indicating the regions of normal variability. Translating the normal variability along an idealized model for pure photoreceptor degenerations produced a region of uncertainty, which is shown as the areas bound by the dashed lines. Figure courtesy of Alexander Sumaroka and Alejandro J. Roman (Scheie Eye Institute, University of Pennsylvania).

