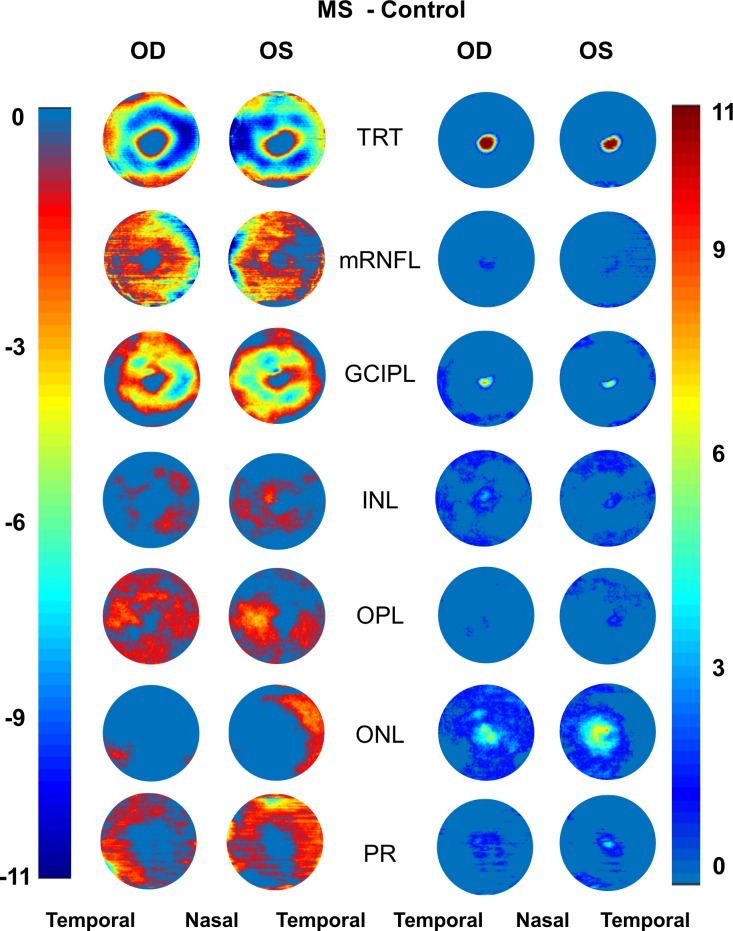
Figure 4.
Negative and positive alterations of intraretinal thickness maps. Subtracting the thickness maps obtained using UHR-OCT of the control group from that of the MS group, the negative (reduced thicknesses) and positive (increased thicknesses) alterations were visualized. In the MS group, negative changes (reduced thicknesses) mainly happened in TRT, mRNFL, GCIPL, OPL, and PR layers in both eyes. Increased thicknesses were evident in the ONL. Scale bar unit: micrometers.

