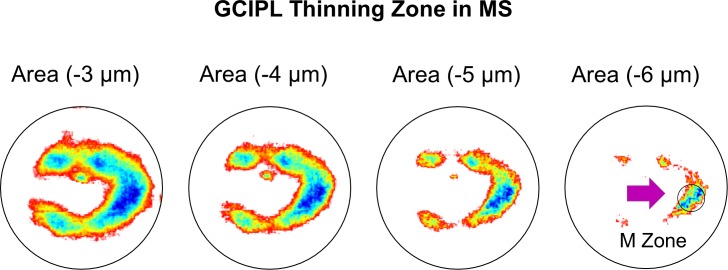
Figure 5.
Focal thickness alteration of the GCIPL in MS eyes. Using different values of the thickness changes, the areas of focal thickness reduction were visualized in MS eyes compared to the control eyes. The most profound thinning zone appeared to locate at nasal 1.98 mm and inferior 0.42 mm from the fovea with a circle zone (diameter = 1 mm), the MS thinning zone of the GCIPL (M zone). The average reduction of the M zone was −7.3 μm in MS eyes, which was higher than any GCIPL sectors using ETDRS partitions (P < 0.05), except for the IS sector (P = 0.08).

