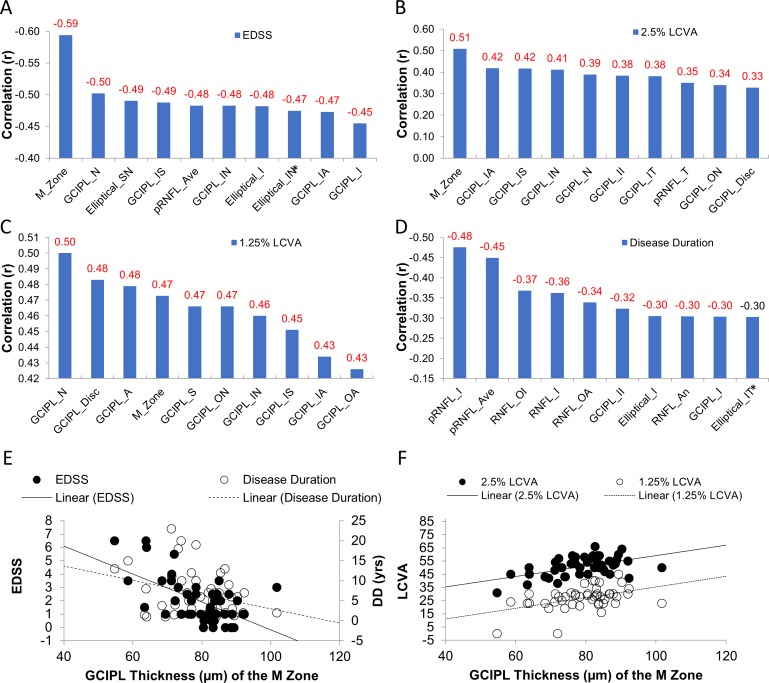
Figure 9.
Correlations between the thicknesses of different partitions of the intraretinal layers with clinical parameters. The thickness of the M zone was negatively related to EDSS (r = −0.59, P < 0.001) (A), which was stronger than any other ETDRS sectors by ranking. The thickness of the M zone was also positively related to the 2.5% LCVA (r = 0.51, P < 0.001 (B), which was the strongest relation by ranking compared to any other ETDRS sectors. The thickness of the M zone was also positively related to 1.25% LCVA (r = 0.47, P < 0.001) (C), which was similar to the relation between GCIPL thickness in the nasal quadrant and 1.25% LCVA (r = 0.50, P < 0.001). The pRNFL-T was most strongly related to disease duration (D). The scatter plots (E, F) showed the relations between the thickness of the M zone and clinical manifestations. A, annulus; ave, average; II, inner inferior. Significant relationships are marked in red (P < 0.05). The measurements between the right and left eyes were averaged.

