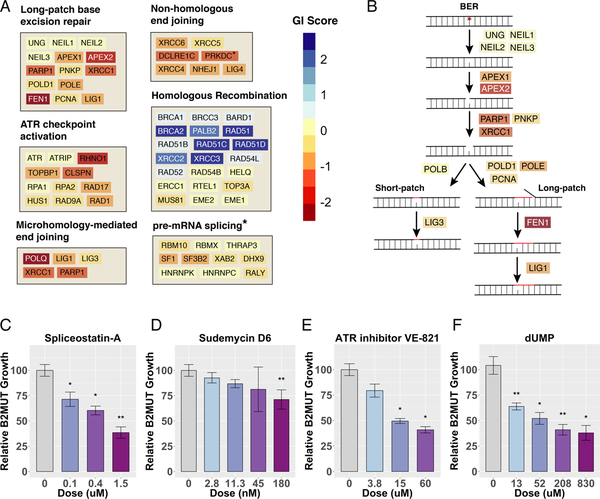
Figure 3. Pathway Analysis of BRCA2 Synthetic Lethality.
(A) Performance of genes in several key pathways, plotted on a color scale for genetic interaction (GI) score: the normalized average log2 fold-change across both colonic and ovarian CRISPR screens. The asterisk indicates reporting of GI score from the shRNA screen instead of combined CRISPR screens. (B) Schematic of the base excision repair (BER) pathway, showing the strength of the GI score for each gene in the pathway, plotted on the same color scale as in (A). (C-F) MCA assays in which colonic GFP-labeled BRCA2 MUT and E2-Crimson-labeled BRCA2 WT cells were mixed and co-treated with the indicated drugs. The change in percent GFP+ cells was measured by FACS after 12 d and normalized to vehicle control. Error bars reflect the variability of biological triplicates.

