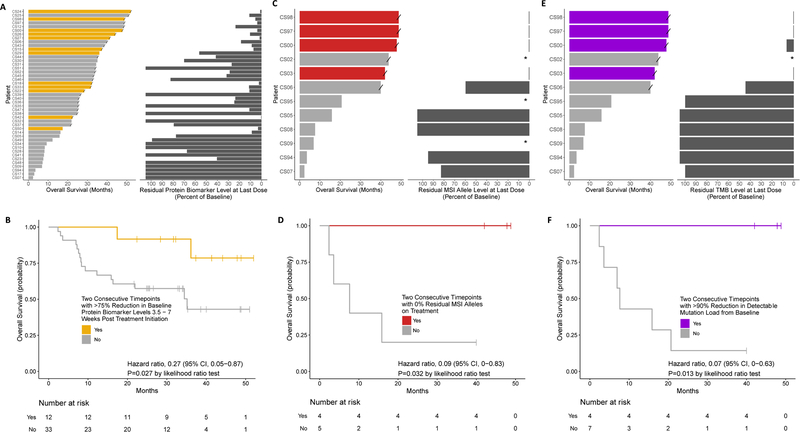
Figure 3. Serial Plasma-Based Overall Survival Analysis for Patients Treated with Immune Checkpoint Blockade.
(A) Evaluation of overall survival with the protein biomarker level at last dose (CA125, CEA, CA19–9, or PSA). A significant inverse correlation was observed between the overall survival in months when compared to the residual protein biomarker (r=-0.67, p=<0.001; Pearson correlation). (B) Kaplan-Meier curves for overall survival among patients with tissue enrollment status of MSI and detectable protein biomarker levels (n=45). For patients with two consecutive timepoints with >75% reduction in protein biomarker levels, landmarked 3.5–7 weeks post treatment initiation (n=12), median overall survival was not reached. For patients with ≤75% reduction in protein biomarker levels (n=33), median overall survival was 35.1 months. (C) Evaluation of overall survival compared to residual MSI allele levels at last dose. A significant inverse correlation was observed between the overall survival when compared to the residual MSI allele levels (r=-0.91, p=<0.001; Pearson correlation). (D) Kaplan-Meier curves for overall survival among patients with tissue enrollment status of MSI and detectable MSI status at baseline (n=9). For patients with two consecutive timepoints displaying no residual MSI alleles (n=4) median overall survival was not reached. For patients with multiple timepoints containing residual MSI alleles (n=5) median overall survival was 7.64 months. (E) Evaluation of overall survival compared to residual TMB levels at last dose. A significant inverse correlation was observed between the overall survival in months when compared to the residual TMB levels (r=-0.95, p=<0.001; Pearson correlation). (F) Kaplan-Meier curves for overall survival among patients with tissue enrollment status of MSI and detectable TMB levels at baseline (n=11). For patients with >90% reduction in TMB levels (n=4), median overall survival was not reached. For patients with ≤90% reduction in TMB levels (n=7), median overall survival was 7.64 months. “/” indicates a censored datapoint; “*” indicates cases where baseline protein biomarker, MSI or TMB was not detected and were not included in the subsequent analyses; In cases where residual protein biomarker, MSI or TMB levels increased when compared to baseline, values of greater than 100% are indicated.

