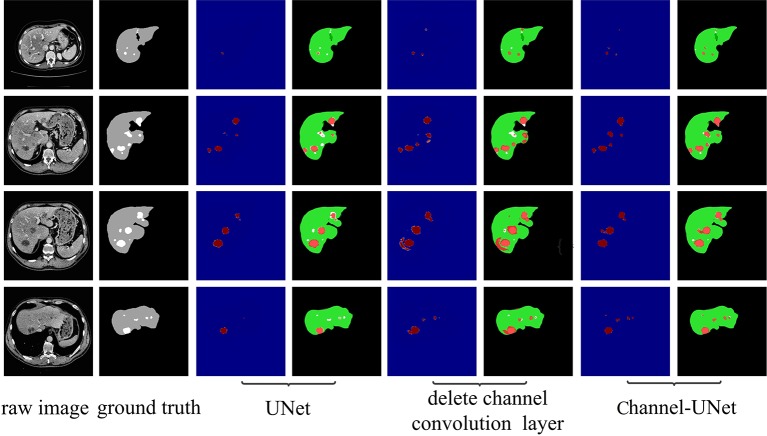
Figure 9.
Tumor segmentation results by ablation study on validation dataset. The gray regions denote the true liver while the white ones denote the true tumors. Columns 3, 5, and 7 show the heat map of tumor segmentation. Columns 4, 6, and 8 show the results of tumor segmentation, where red represents the tumor and green represents the liver.

