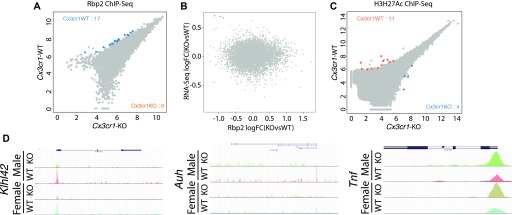
Figure 2. Active promoter landscape of Cx3cr1-KO and –WT samples shows minor differences in Rbp2 binding.
Microglia were isolated from 2-mo-old Cx3cr1+/+ (WT) or Cx3cr1eGFP/eGFP (KO) mice, pooling brains from three gender-matched mice to obtain samples for chromatin immunoprecipitation followed by sequencing. (A) ChIP-seq for Rbp2, a mark of actively transcribed genes, indicates few significant differences between the genotypes. Only genes with at least four sequencing reads in at least one of the genotypes are shown, with genes reaching statistical significance highlighted in blue. (B) There is minimal correlation between mRNA expression (fold change determined by RNA-seq) and active transcription (Rbp2 binding determined by ChIP-seq). Genes with fold change > |1.5| are highlighted in coral. (C) ChIP-seq for H3K27Ac, a mark of open and active chromatin, indicates few significant differences between the genotypes. Only genes with at least four sequencing reads in at least one of the genotypes are shown, with genes reaching statistical significance highlighted in blue and coral. (D) The UCSC browser snapshots of Rbp2 binding for selected genes. Exons are represented by boxes, and direction of transcription is indicated by arrows in introns.

