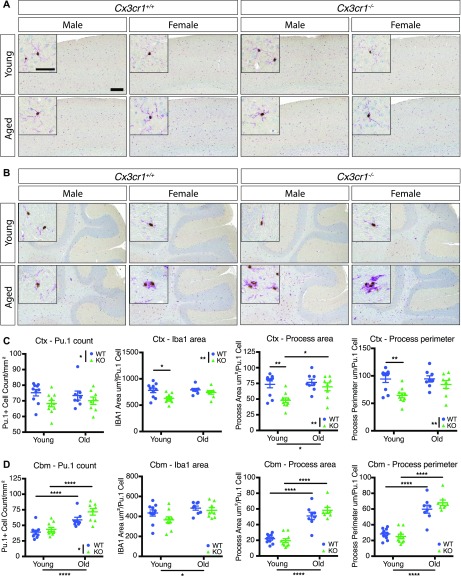
Figure 7. Cx3cr1 deletion alters microglial morphology in young and aged mice.
(A, B) Representative images of brain sections from the cortex (A) or cerebellum (B) of young (2 mo) or old (18–24 mo) Cx3cr1+/+ or Cx3cr1eGFP/eGFP male or female mice immunoreacted with anti-Iba1 (purple) and anti-Pu.1 (brown). Note the overall different microglial morphology in the cerebellum in both young and old mice compared with the cortex. Many microglial clusters were detectable in the cerebellum of old animals of either genotype. Scale bar: large image, 200 μm; inset, 50 μm. (C, D) Quantification of microglial cell numbers and morphology in the cortex (C) and the cerebellum (D). Microglial cell numbers were quantified as the number of Pu.1-positive nuclei per unit area. Microglial morphology was assessed as the total Iba1 immunoreactive area per Pu.1+ nucleus, dendritic process area per Pu.1+ nucleus, and dendritic process perimeter per Pu.1+ nucleus. Only processes attached to nuclei were included in the dendritic process calculations. Statistics: two-way ANOVA (for genotype and age) and Tukey’s post hoc test. Only select significant intergroup comparisons are shown. *P < 0.05; **P < 0.01; ***P < 0.001; ****P < 0.0001. Ctx cell number: genotype: F(1,32) = 4.892, P = 0.0342; age: F(1,32) = 0.0001061, P = 0.9918; interaction: F(1,32) = 0.61, P = 0.4405. Ctx Iba1 area: genotype: F(1,32) = 8.461, P = 0.0065; age: F(1,32) = 3.225, P = 0.0820; interaction: F(1,32) = 2.182, P = 0.1494. Ctx process area: genotype: F(1,32) = 9.908, P = 0.0035; age: F(1,32) = 5.665, P = 0.0234; interaction: F(1,32) = 3.165, P = 0.0847. Ctx process perimeter: genotype: F(1,32) = 11.31, P = 0.0020; age: F(1,32) = 2.868, P = 0.1000; interaction: F(1,32) = 2.777, P = 0.1054. Cbm cell number: genotype: F(1,32) = 4.982, P = 0.0327; age: F(1,32) = 31.08, P < 0.0001; interaction: F(1,32) = 1.119, P = 0.2817. Cbm Iba1 area: genotype: F(1,32) = 2.602, P = 0.1165; age: F(1,32) = 6.502, P = 0.0158; interaction: F(1,32) = 0.6807, P = 0.4154. Cbm process area: genotype: F(1,32) = 0.5592, P = 0.4601; age: F(1,32) = 113, P < 0.0001; interaction: F(1,32) = 2.322, P = 0.1374. Cbm process perimeter: genotype: F(1,32) = 0.5271, P = 0.4731; age: F(1,32) = 118.5, P < 0.001; interaction: F(1,32) = 2.745, P = 0.1073.

