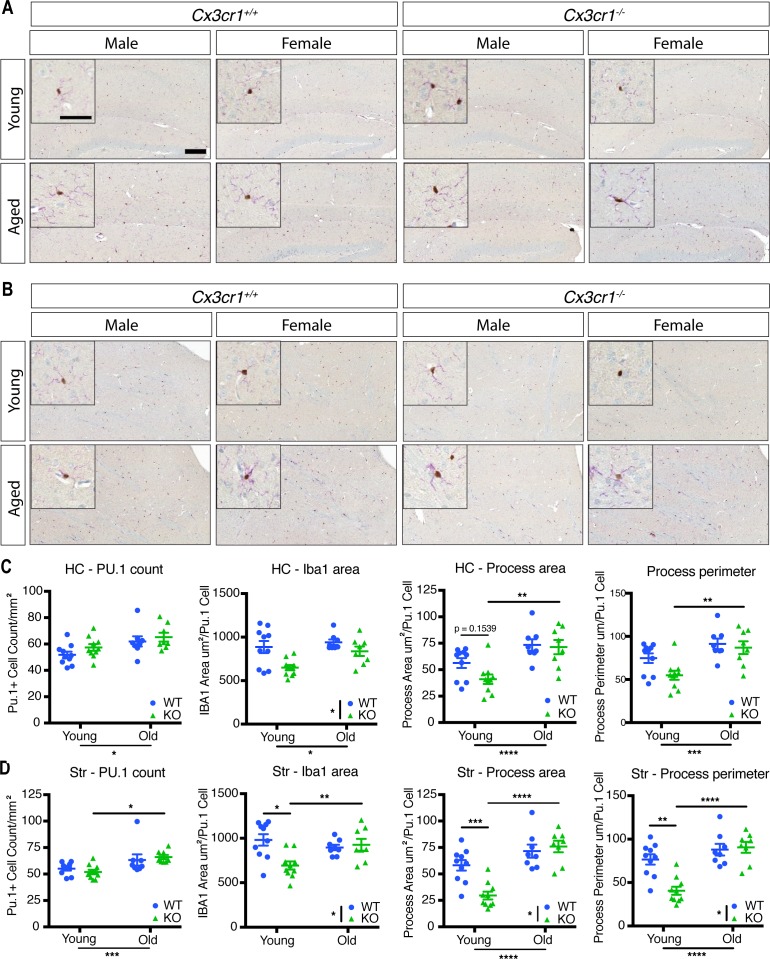
Figure S5. Cx3cr1 deletion alters microglial morphology in the HC and striatum of young and aged mice.
(A, B) Representative images of the brain section from the HC (A) or striatum (B) of young (2 mo) or old (18–24 mo) Cx3cr1+/+ or Cx3cr1eGFP/eGFP male or female mice immunoreacted with anti-Iba1 (purple) and anti-Pu.1 (brown). Scale bar: large image, 200 μm; inset, 50 μm. (C, D) Quantification of microglial cell numbers and morphology in the HC (C) and the striatum (D). Microglial cell numbers were quantified as the number of Pu.1-positive nuclei per unit area. Microglial morphology was assessed as the total Iba1 immunoreactive area per Pu.1+ nucleus, dendritic process area per Pu.1+ nucleus, and dendritic process perimeter per Pu.1+ nucleus. Only processes attached to nuclei were included in the dendritic process calculations. Statistics: two-way ANOVA (for genotype and age) and Tukey’s post hoc test. Only select significant intergroup comparisons are shown. *P < 0.05; **P < 0.01; ***P < 0.001; ****P < 0.0001. HC cell number: genotype: F(1,32) = 2.159, P = 0.1515; age: F(1,32) = 8.952, P = 0.0053; interaction: F(1,32) = 0.1583, P = 0.6934. HC Iba1 area: genotype: F(1,32) = 11.1, P = 0.0022; age: F(1,32) = 5.603, P = 0.0241; interaction: F(1,32) = 1.685, P = 0.2036. HC process area: genotype: F(1,32) = 2.69, P = 0.1108 Age: F(1,32) = 20.21, P < 0.0001; interaction: F(1,32) = 1.566, P = 0.2199. HC process perimeter: genotype: F(1,32) = 3.972, P = 0.0548; age: F(1,32) = 16.07, P = 0.003; interaction: F(1,32) = 1.647, P = 0.2086. Str cell number: genotype: F(1,32) = 0.005704, P = 0.9403; age: F(1,32) = 14.24, P = 0.0007; interaction: F(1,32) = 0.9689, P = 0.3323. Str Iba1 area: genotype: F(1,32) = 5.419, P = 0.0264; age: F(1,32) = 1.819, P = 0.1870; interaction: F(1,32) = 8.379, P = 0.0068. Str process area: genotype: F(1,32) = 5.746, P = 0.0225; age: F(1,32) = 34.86, P < 0.0001; interaction: F(1,32) = 10.53, P = 0.0027. Str process perimeter: genotype: F(1,32) = 8.114, P = 0.0076; age: F(1,32) = 27.4, P < 0.0001; interaction: F(1,32) = 10.9, P = 0.0024.

