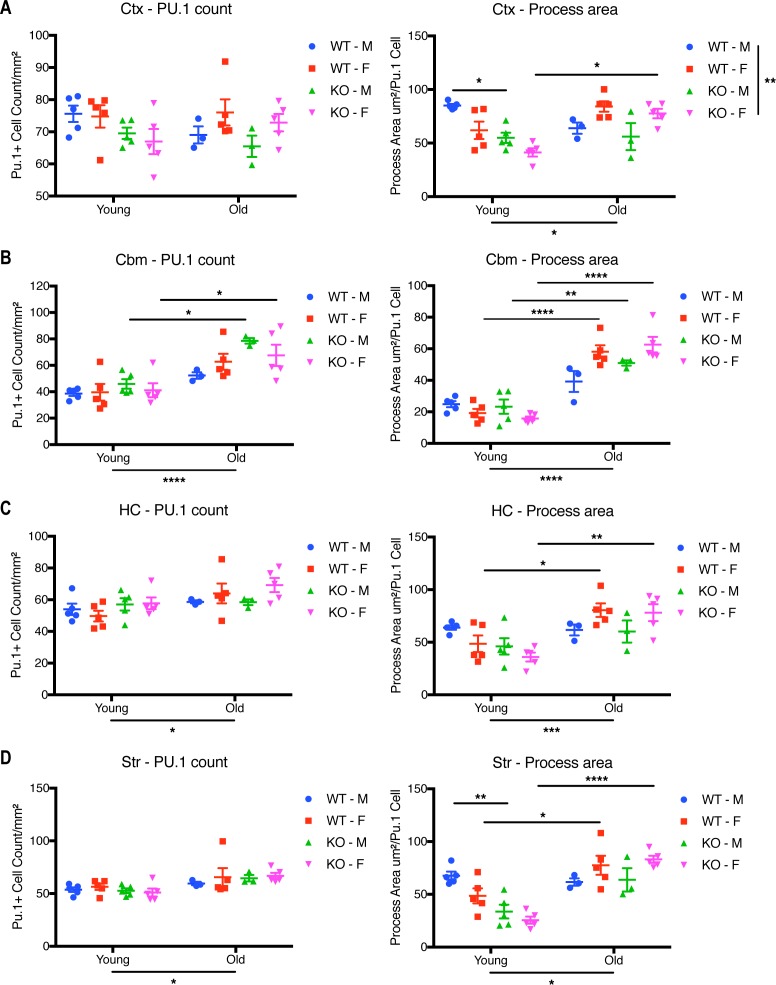
Figure S6. Effect of gender on the morphology of microglia in young and old mice.
Sections from young (2 mo) or old (18–24 mo) Cx3cr1+/+ or Cx3cr1eGFP/eGFP male or female mice were immunoreacted with anti-Iba1 (purple) and anti-Pu.1 (brown). (A, B, C, D) Quantification of microglial cell numbers and morphology in the cortex (A), cerebellum (B), HC (C) and the striatum (D). Microglial cell numbers were quantified as the number of Pu.1-positive nuclei per unit area. Microglial morphology was assessed as dendritic process area per Pu.1+ nucleus. Only processes attached to nuclei were included in the dendritic process calculations. Statistics: Two-way ANOVA (for genotype and age) and Tukey’s post-hoc test. Only select significant intergroup comparisons are shown. *P < 0.05; **P < 0.01; ***P < 0.001; ****P < 0.0001. Ctx Cell number: Genotype: F(3,28) = 2.136, P = 0.1181; Age: F(1,28) = 0.138, P = 0.2581; Interaction: F(3,28) = 1.419, P = 0.2581. Ctx Process area: Genotype: F(3,28) = 5.209, P = 0.0055; Age: F(1,28) = 5.439, P = 0.0271; Interaction: F(3,28) = 9.132, P = 0.0002. Cbm Cell number: Genotype: F(3,28) = 2.752, P = 0.0613; Age: F(1,28) = 36.38, P < 0.0001; Interaction: F(3,28) = 0.8772, P = 0.4647. Cbm Process area: Genotype: F(3,28) = 1.401, P = 0.2631; Age: F(1,28) = 140.5, P < 0.0001; Interaction: F(3,28) = 6.773, P = 0.0014. HC Cell number: Genotype: F(3,28) = 1.309, P = 0.2909; Age: F(1,28) = 6.797, P = 0.0145; Interaction: F(3,28) = 0.9511, P = 0.4294. HC Process area: Genotype: F(3,28) = 1.124, P = 0.3561; Age: F(1,28) = 18.97, P = 0.0002; Interaction: F(3,28) = 3.947, P = 0.0.0182. Str Cell number: Genotype: F(3,28) = 0.3224, P = 0.8091; Age: F(1,28) = 11.39, P = 0.0022; Interaction: F(3,28) = 0.4544, P = 0.7163. Str Process area: Genotype: F(3,28) = 2.551, P = 0.0757; Age: F(1,28) = 36.56, P < 0.0001; Interaction: F(328) = 8.065, P = 0.0005.

