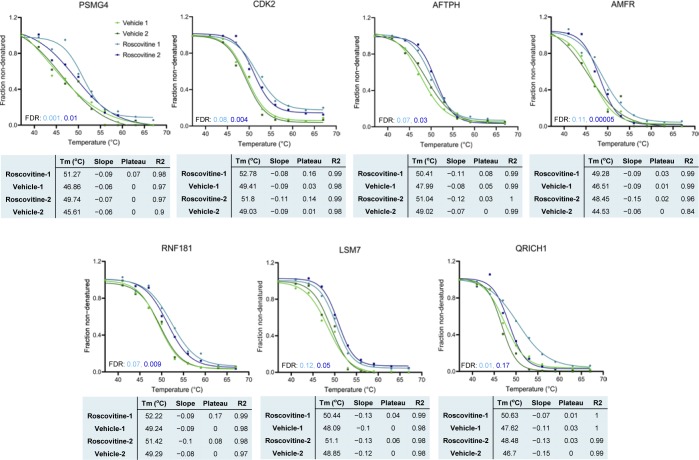
Figure S11. TPP melting curves for the potential target proteins stabilized by roscovitine.
Data from two independent replicate experiments are shown. Four inclusion filters were used to determine the quality of the result for each protein. (i) Minimum slope in each of the control versus treatment experiments <−0.06. (ii) Melting point differences in the control versus treatment experiments greater than the melting point difference between the two untreated controls. (iii) Multiple testing (FDR) corrected P-value for one of the two replicate experiments <0.1. (iv) Melting point shifts in the two control versus treatment experiments have a positive sign (i.e., protein was stabilized in both cases).

