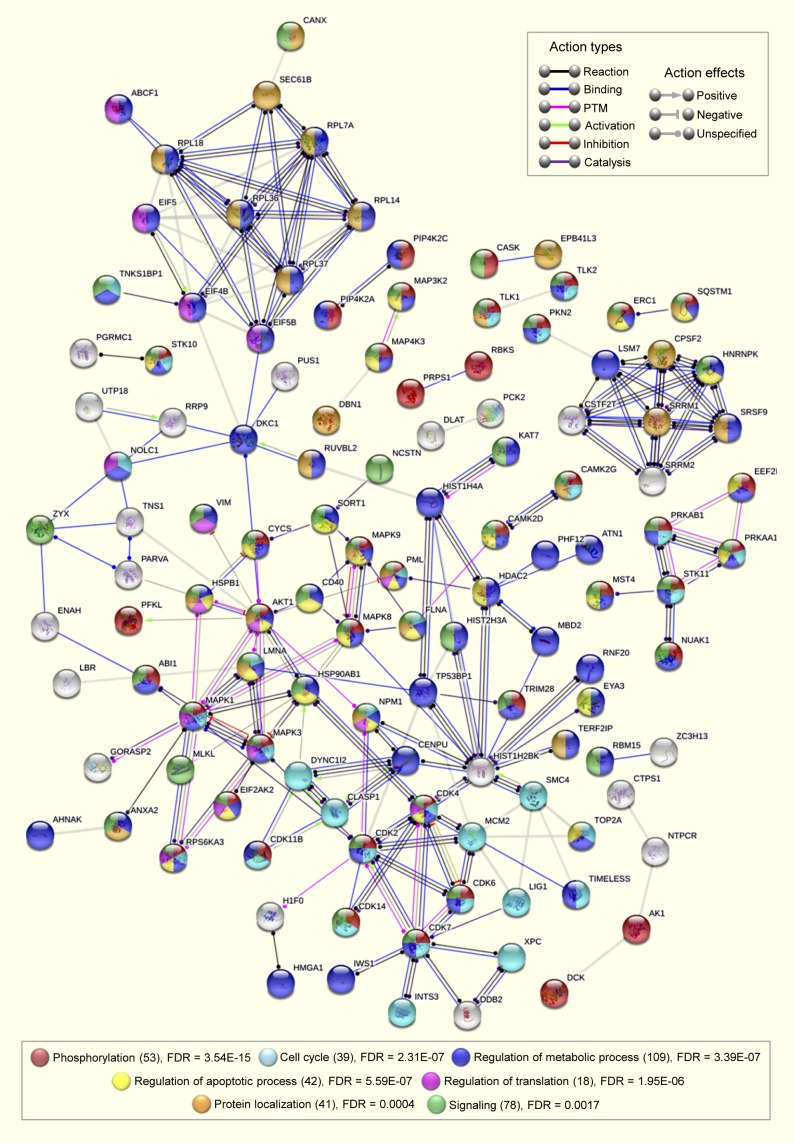
Figure S15. A comprehensive interaction map of cellular responses induced by circadian rhythm–altering compounds.
Interaction networks among the altered proteins, phosphoproteins and kinases induced by circadian period–altering compounds and their potential binding targets (identified in TPP analysis). This association network (PPI enrichment P-value 9.06 × 10⁻¹¹) is generated using STRING database involving only the high confidence (score > 0.8) interactions.

