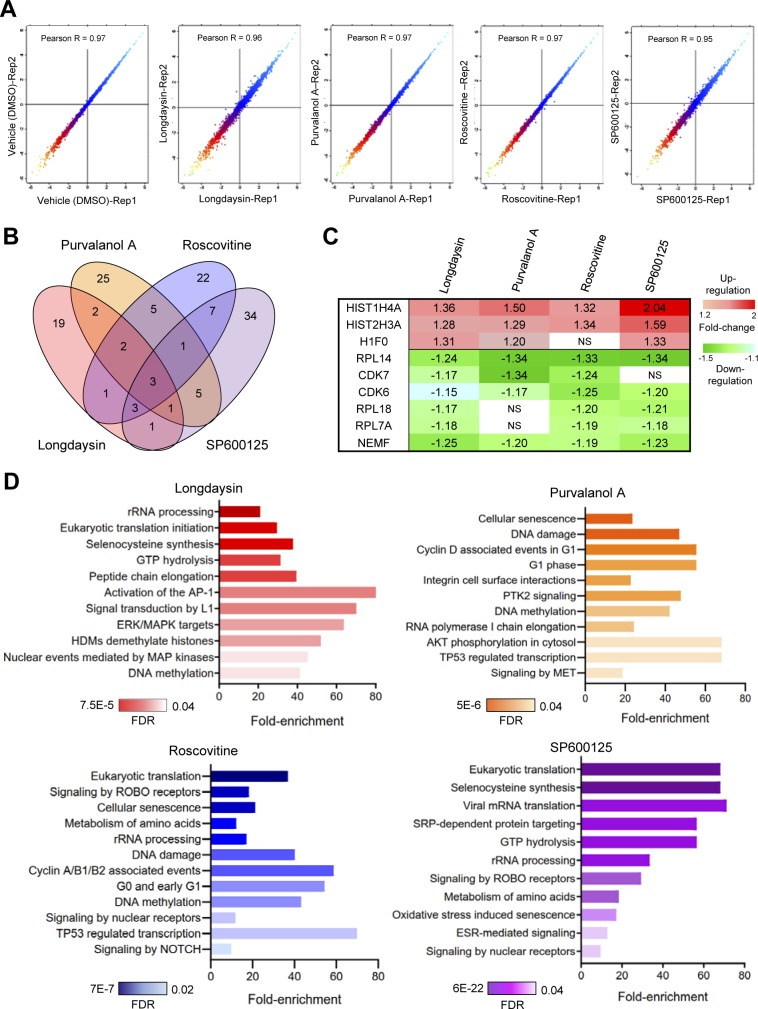
Figure S2. Quantitative proteomics analysis of circadian period–lengthening compounds induced alterations in U2OS cells.
(A) Scatter plots showing correlations in protein expression profiles (log2 transformed) between the replicates of control and drug-treated samples. (B) Venn diagram representing overlaps among the differentially abundant proteins (pAdj < 0.05) identified in longdaysin-, purvalanol A–, roscovitine-, and SP600125-treated cells. (C) Relative abundance (against DMSO control) of the commonly altered proteins in longdaysin-, purvalanol A–, roscovitine-, and SP600125-treated cells (mean, n = 3). NS indicates pAdj > 0.05. (D) Physiological pathways (Reactome, FDR < 0.05) associated with the differentially abundant proteins identified in U2OS cells after treating with circadian period–lengthening compounds. Statistical overrepresentation tests were performed using PANTHER (Protein ANalysis THrough Evolutionary Relationships) classification system (http://www.pantherdb.org).

