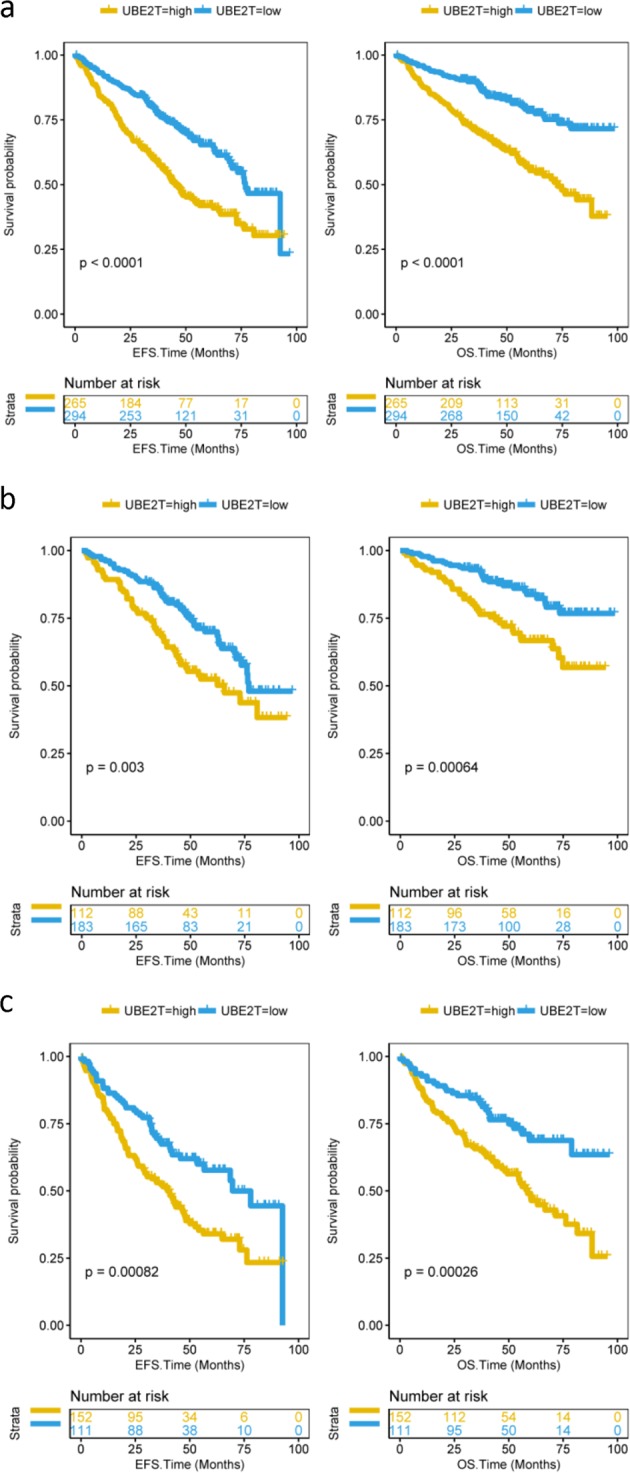
Fig. 3.

EFS and OS between UBE2T high and low groups. a EFS and OS in total 559 MM patients. Compared to the UBE2T low group, the patients in the high group had poor EFS and OS. EFS event-free survival time (months), OS overall survival time (months). Log-rank test. EFS: P < 0.0001; OS: P < 0.0001. b EFS and OS in stage I MM patients. Compared to the UBE2T low group, stage I patients in the high group had poor EFS and OS. Log-rank test. EFS: P = 0.003; OS: P = 0.00064. c EFS and OS in stage II or stage III patients. Compared to UBE2T low group patients, high group patients had lower EFS and OS. Log-rank test. EFS: P = 0.00082; OS: P = 0.00026
